|
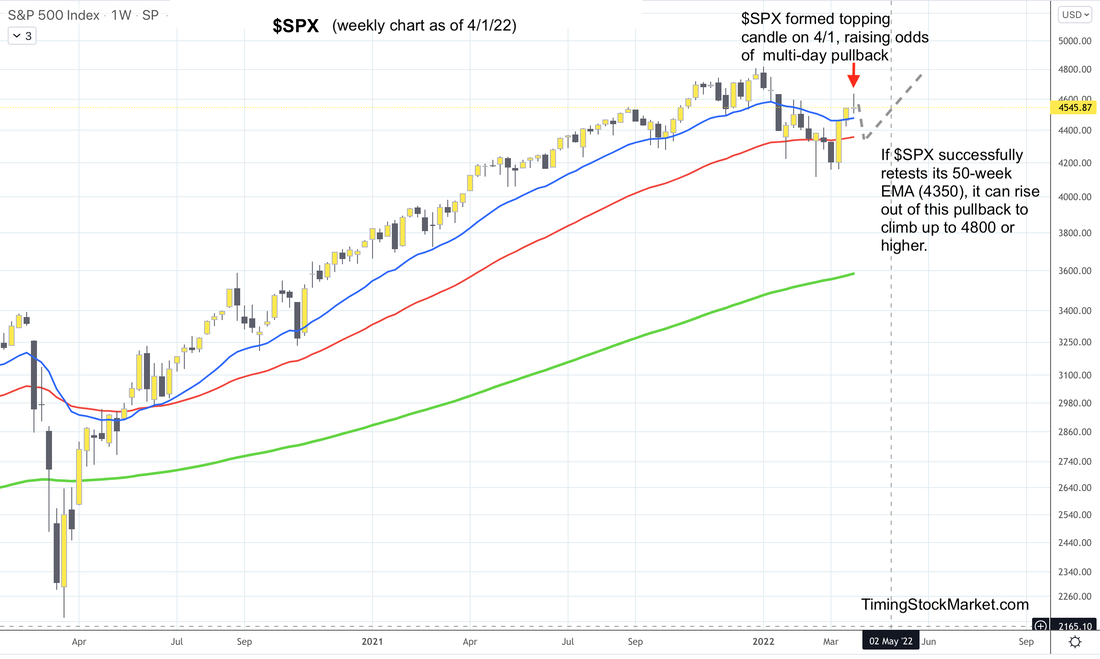
We trade 3x ETFs such as TQQQ TNA SOXL LABU UVXY using proprietary analysis of volatility. Current trade record here. Updates 6:30 PM ET - Sunday 4/3/22 Upcoming key events This week is light in economic reports, but there are few Fed speakers as well as the release of FOMC minutes to stir things up a bit. 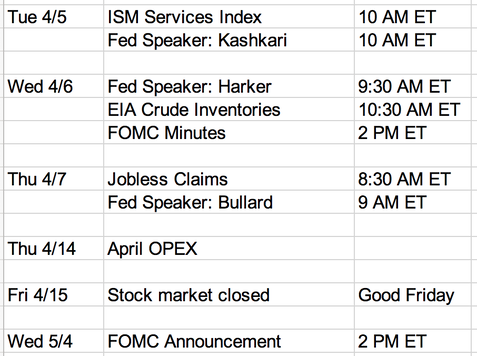 Key Price Levels The table below has been fully updated. These new price levels will be in focus this week. Table is available in members section. Weekly index charts confirm "Approaching Bearish" $VVIX has been warning us that volatility is about to rise some amount. This means stock indices are about to pull back a certain amount. Stock conditions have changed to "Approaching Bearish". This is confirmed by the topping candles formed on $SPX $NDX IWM charts. How much of a drop can we expect and how long? We don't think stock indices are starting a lower-low leg in a bear market. Rather, they are building the 2nd leg of a really big W from which they can propel themselves higher, getting out of the bear market for real. This potential path is shown on $SPX weekly chart below. Here are our projections:
 "Happy stocks" charts confirm "Approaching Bearish" The weekly chart of Nasdaq percentage of stocks above 200-day MA shows a big topping candle formed right at the 20-week EMA blue line. The odds are high that this percentage will drop, possibly to retest 20% again. This confirms the "Approaching Bearish" condition for $NDX. NYSE and small cap charts are showing similar patterns as well. 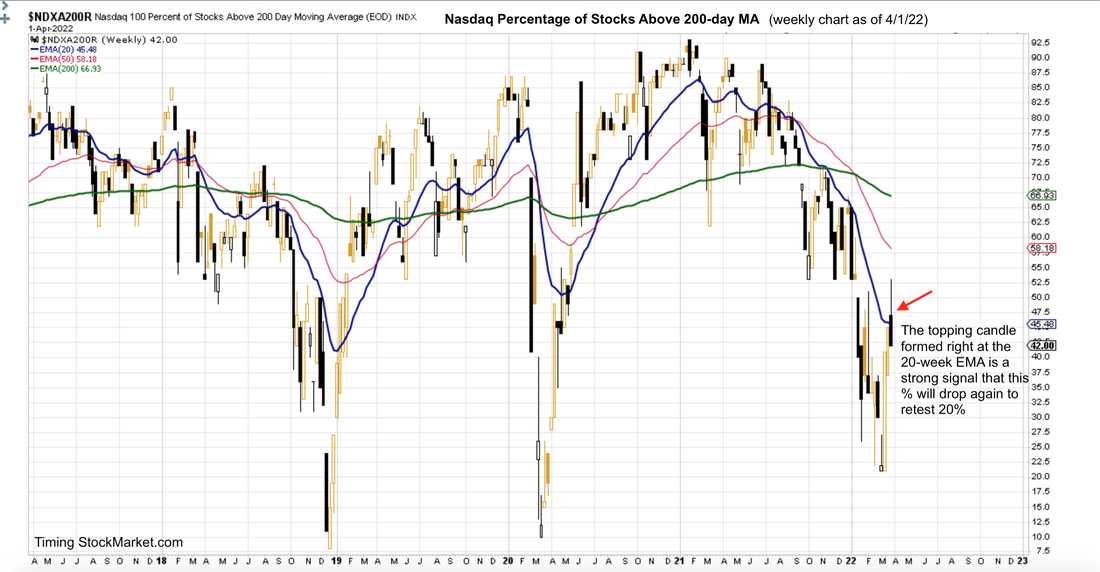 Volatility confirms "Approaching Bearish" Read more about $VIX $VXN $RVX $VVIX and the effects of options and hedging on the market here. Volatility of volatility ($VVIX) formed a complete W bottom by 4/1, setting the stage for a possible multi-day climb back up. $VIX $VXN $RVX all confirm the "Approaching Bearish" conditions. 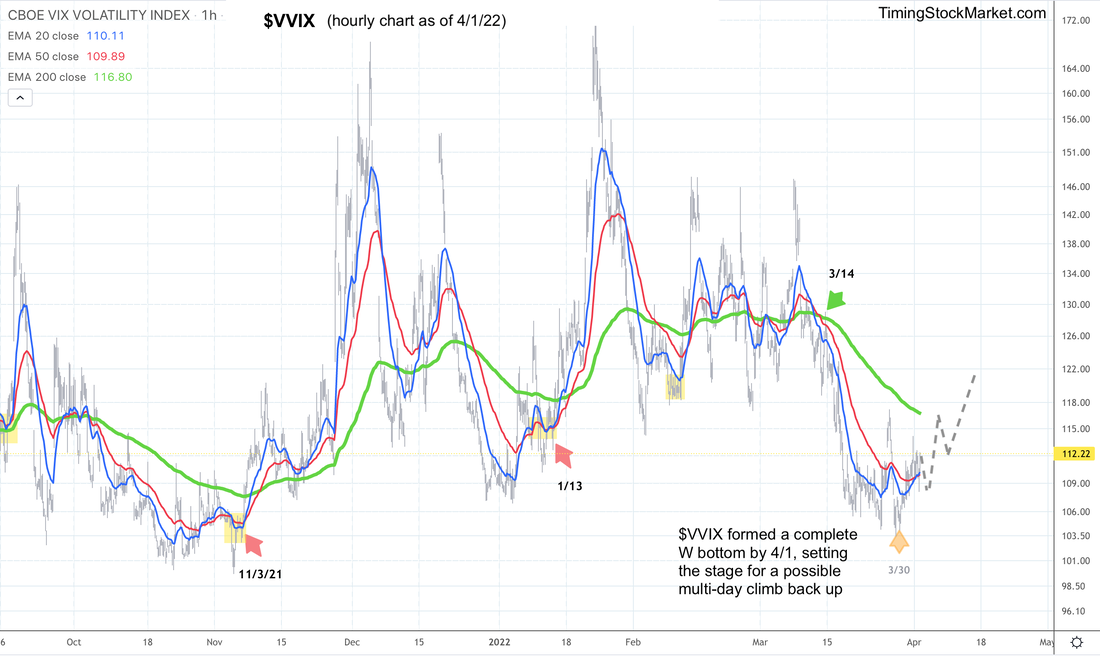 Supplemental Indicators Equity Put/Call ratio: This ratio has stopped dropping and started rising steadily since 3/25. This means traders are starting to buy more puts for hedging and shorting purpose. This confirms the "Approaching Bearish" conditions. Dealer hedging: If $SPX $NDX IWM drop and stay below Friday's lows, current state of dealer hedging will fuel volatility. This is because dealers will be selling into weakness and buying into strength, thereby creating sharp price swings. Bonds: Bond volatility (MOVE) has been rising sharply for the last several weeks. Junk bonds (JNK HYG) weekly charts show topping patterns. Junk bonds tend to behave like equities. This confirms the "Approaching Bearish" conditions. Dark Pool Index: This index is starting to show a topping pattern, confirming the "Approaching Bearish" conditions. Trade Plan After $VIX $VVIX form a W bottom, they will be ready to rise for multiple days. We plan to capture this rise volatility and drop in price via UVXY and SQQQ. The charts below show the possible price paths for UVXY and SQQQ. Note that we plan to scale into both positions at the lows of last week, and take partial profits along the way. Click here for UVXY SQQQ charts and current buy/sell orders. Subscribe to get our latest analysis, trade plans and live intraday trades. Current trade record here. Disclaimer The information presented here is our own personal opinion. Consider it as food for thought. We are not offering financial advice. We are not promoting any financial products. We are not registered financial advisers or licensed brokers. We make no guarantee that anything will unfold according to our projections. You are proceeding at your own risk if you follow our trades.
1 Comment
Jill
4/14/2022 04:12:32 pm
HI Leave a Reply. |
Archives
February 2024
Categories |
 RSS Feed
|
|
Copyright (c) 2019-2024 LOOK Systems LLC
All rights reserved. |