Updates 10:30 PM ET - Sunday Upcoming key events There are 2 key dates that may see a rise in $VIX. First is April VIX options expiration this Wednesday. Once these options expire, we may see a fresh rise in demand for new $VIX calls (long volatility) and equity puts (short stocks). This demand may increase substantially as traders feel the need to hedge ahead of FOMC announcement on May 4. 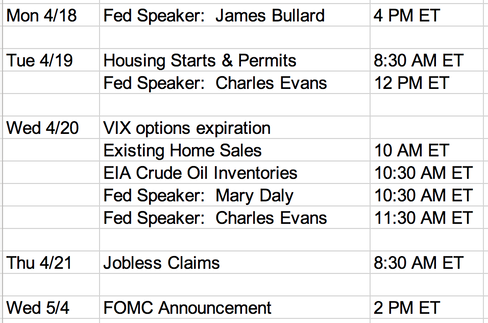 Key Price Levels The table below has been updated for all but IWM TNA. L1 is a strong support level, and this is where we expect the current sell-off to end. 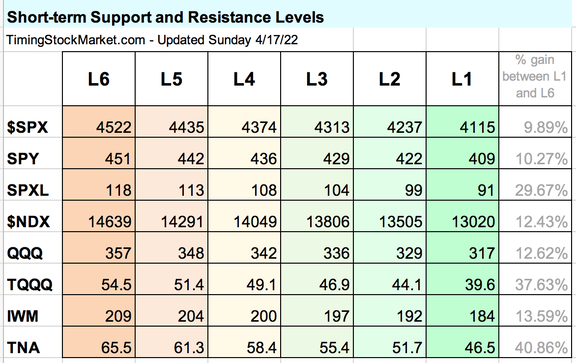 The Big Picture: bad news and good news We've been relying on the Percentage of Happy Stocks chart to show us a pretty accurate snapshot of big picture market moods. ("Happy Stocks" are stocks that are above their 200-day MA). Below is the Nasdaq Happy Stocks chart. There are two important messages on this chart. Bad news: Last week we wrote this about the percentage of Nasdaq Happy Stocks: It is on its way to retest 20% zone. This path seems to be happening for not only $NDX, but also $SPX and IWM as well. This signal is currently "Fully Bearish". We're unlikely to see real recovery before Nasdaq tests 20%. Good news: This is a chart pattern that we typically see at the end of a bear market, not at the beginning. This pattern is close to capitulation. The percentage may bottom out anywhere between 20% and 10%. After that we typically see a very bullish sharp rise back up as a new bull market starts. 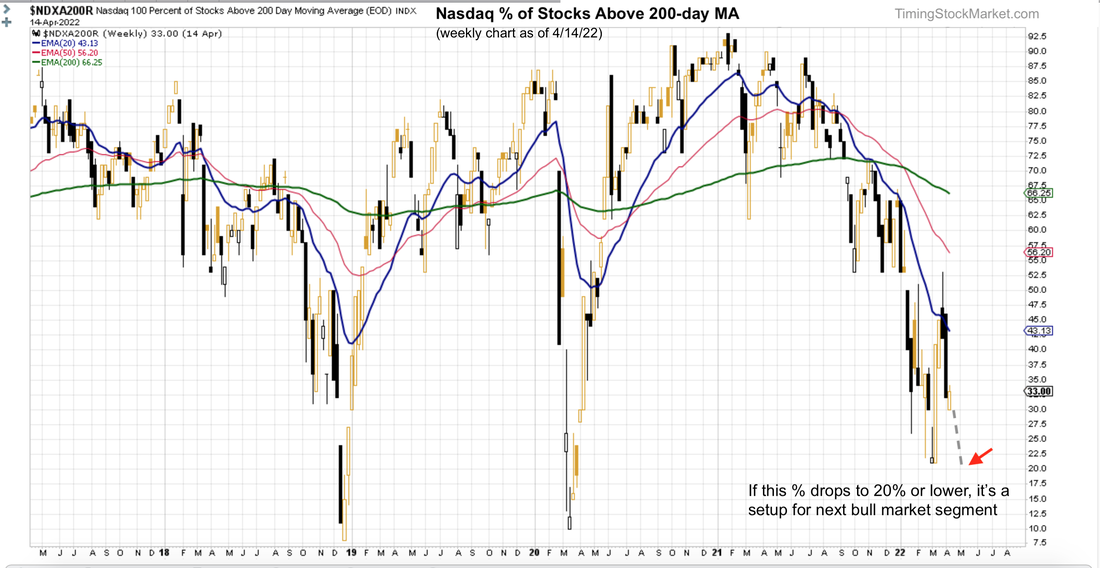 Volatility confirms "Fully Bearish" Read more about $VIX $VXN $RVX $VVIX and the effects of options and hedging on the market here. On 3/29, volatility of volatility ($VVIX) gave us the initial warning that market conditions were "Approaching Bearish" as a new volatility cycle was starting back up. Since then, $VVIX has been coiling upward. $VVIX 20 EMA blue line and 50 EMA red line are about to cross over the 200 EMA green line. As you can see from previous patterns, this is typically a setup for $VVIX to surge. We may see $VVIX revisits the high of March 8. 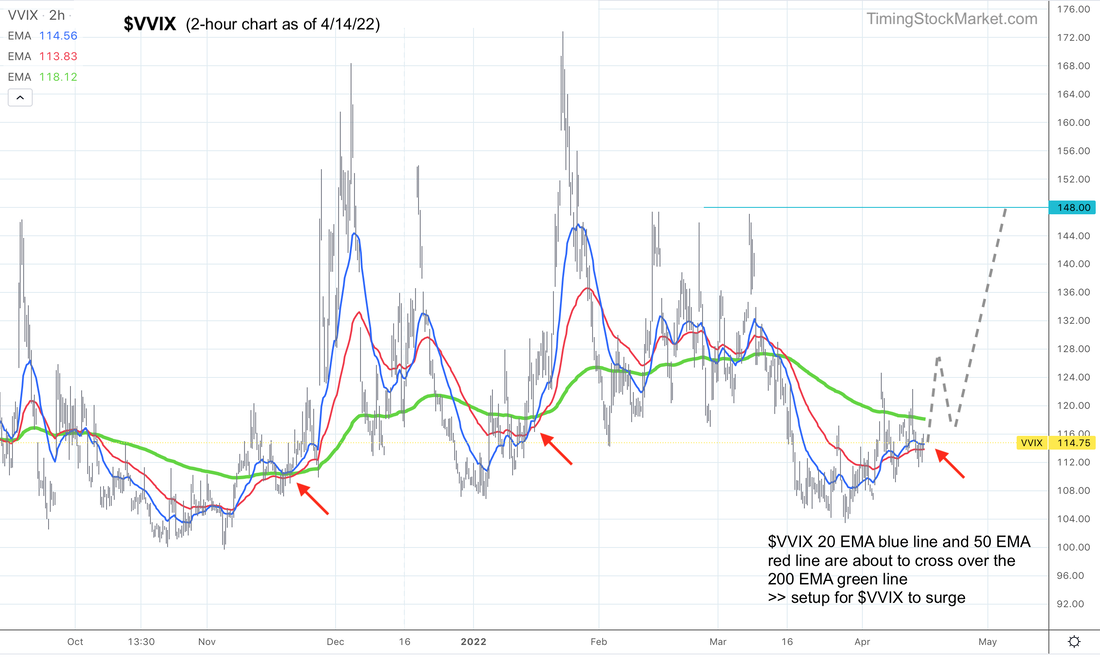 Meanwhile $VIX weekly chart showed that it has formed a couple of contracted weekly candle, anchored on its 200-week EMA green line. This is typically a setup for $VIX to surge. 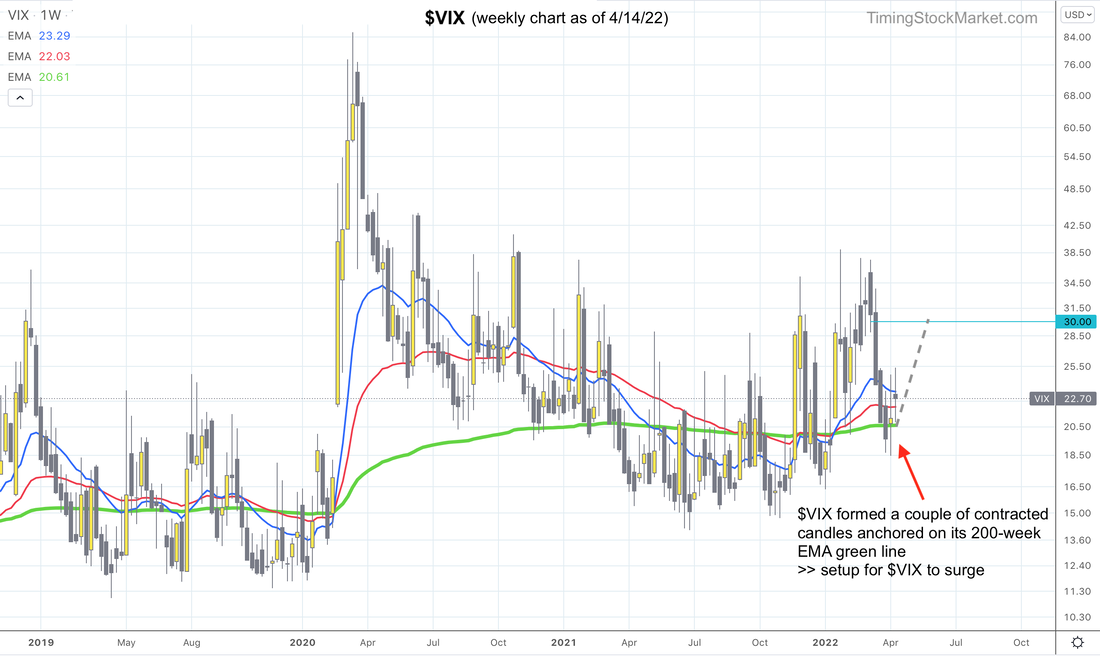 Supplemental Indicators: confirm "Fully Bearish" (mostly)
Dealer hedging: $SPX $NDX IWM are currently below the key levels where dealer hedging turns to "fueling volatility". This means that dealers are now buying strength and selling weakness, potentially creating big swings in price. This is typical of "Fully Bearish" conditions. Nasdaq is the leader on the way down Keep an eye on $NDX. It has a good chance of finding bottoms at February 24 low. When $NDX finds strong support, $SPX and IWM will also. 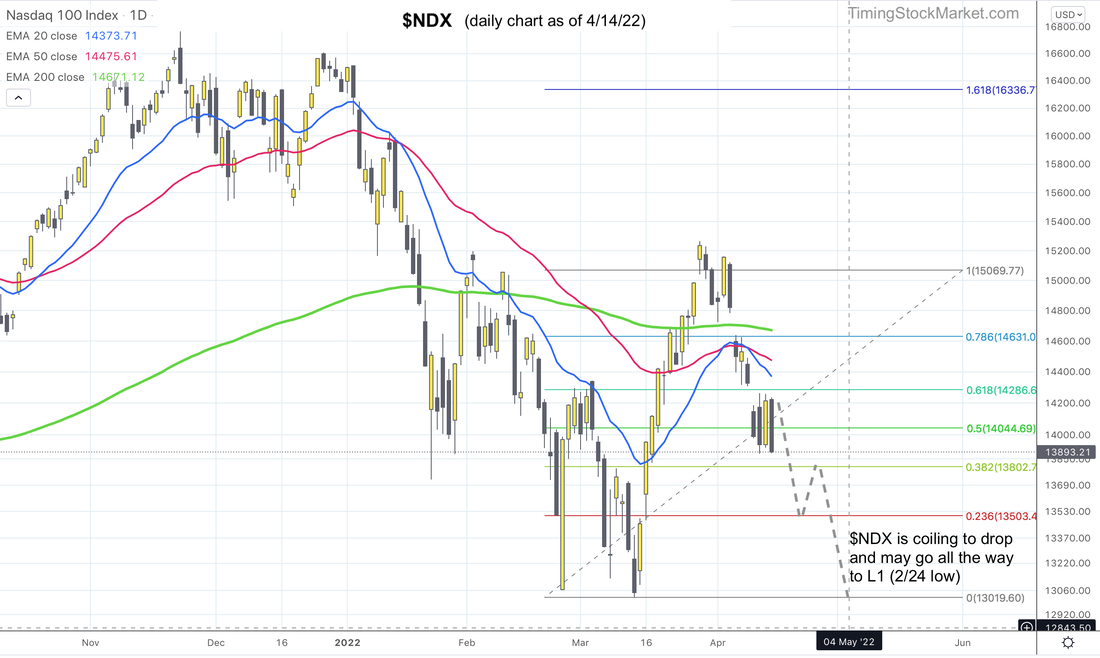 Trade plan While the signal is "Fully Bearish", we will focus on trading SQQQ and UVXY. We won't attempt any counter-signal trades because our record for those trades have not been as successful.
Subscribe to get our latest analysis, trade plans and live intraday trade adjustments. Current trade record: 340% since July 2020 Disclaimer The information presented here is our own personal opinion. Consider it as food for thought. We are not offering financial advice. We are not promoting any financial products. We are not registered financial advisers or licensed brokers. We make no guarantee that anything will unfold according to our projections. You are proceeding at your own risk if you follow our trades.
0 Comments
Leave a Reply. |
Archives
July 2024
Categories |
 RSS Feed
|
|
Copyright (c) 2019-2024 LOOK Systems LLC
All rights reserved. |