Updates 4 PM ET- Thursday 1/12/23 Scaled into TNA post CPI report Based on the projections we wrote about pre-market below, we scaled into our bullish position TNA after the CPI report this morning. 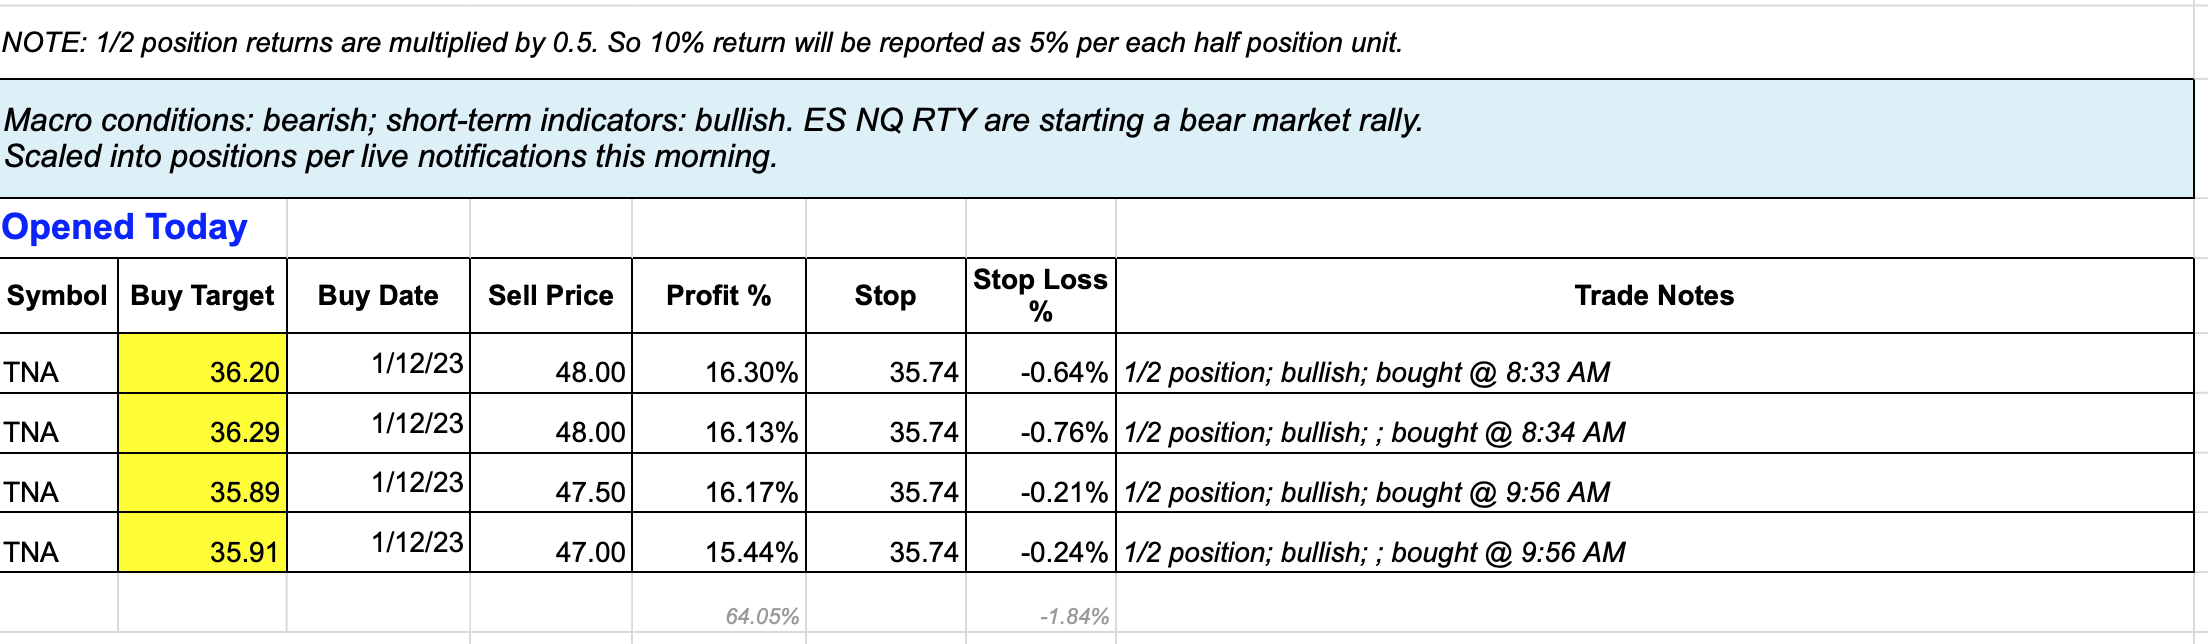 Members were notified of these entries. 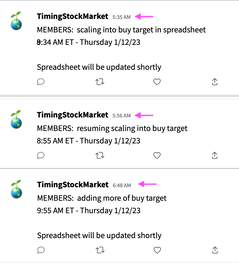 Updates pre-market Thursday 1/12/23 CPI report is released at 8:30 AM ET Thursday. Key S/R levels
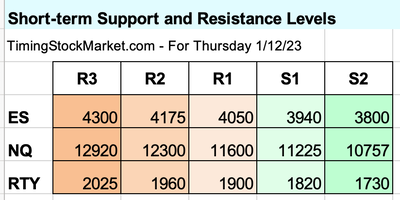 As projected yesterday, ES NQ RTY 15-minute charts all show rising 200 EMA green lines. This shows that the bullishness is continuing. But RSI shows that RTY (as well as ES NQ) are all highly overbought. So to better optimize our entries, we want to wait for price to get down closer to the 200 EMA green line. We also want to wait for RSI to drop down to oversold levels, as shown via all the green arrows below (15-minute chart). We think RSI will swing to oversold and RTY will drop down to closer to its 200 EMA green line when RTY revisits the zone of around S1 (1815 - 1830). The same is true for ES and NQ. 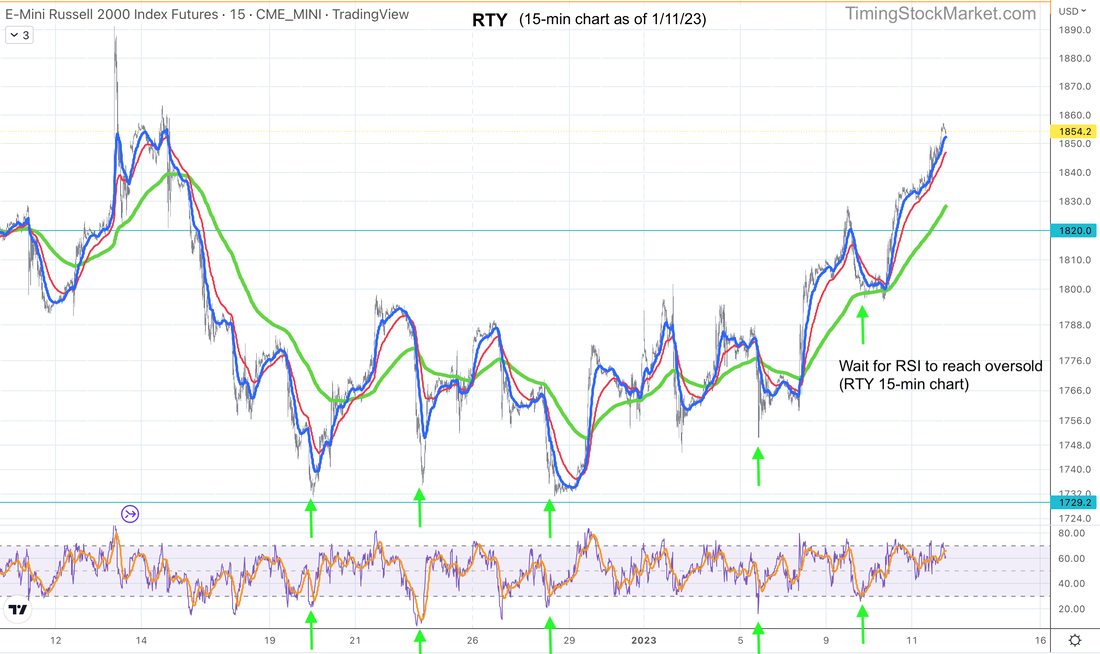 New bull market starting? You read that right. The weekly chart for S&P 500 Percent of Stocks Above 200-day MA below is telling us that a bull market may actually be building up under the hood. This is because its 20-week EMA blue line is crossing above its 50-week EMA red line. This crossing is not easily done on a weekly chart after a massive steep drop. So for the pattern to form, market breadth has to have been rising strongly. In the past this pattern has been quite reliable in predicting a new bull market (see the green arrows on chart below). This does not mean that we won't see pullbacks. But what this means is that 3700 may be a very strong support level, as well as a potential bottom for ES and $SPX. This signal could be totally wrong here. After all, macro fundamentals are still very bleak. But it's worth contemplating this possibility, and pay attention to these EMA lines. 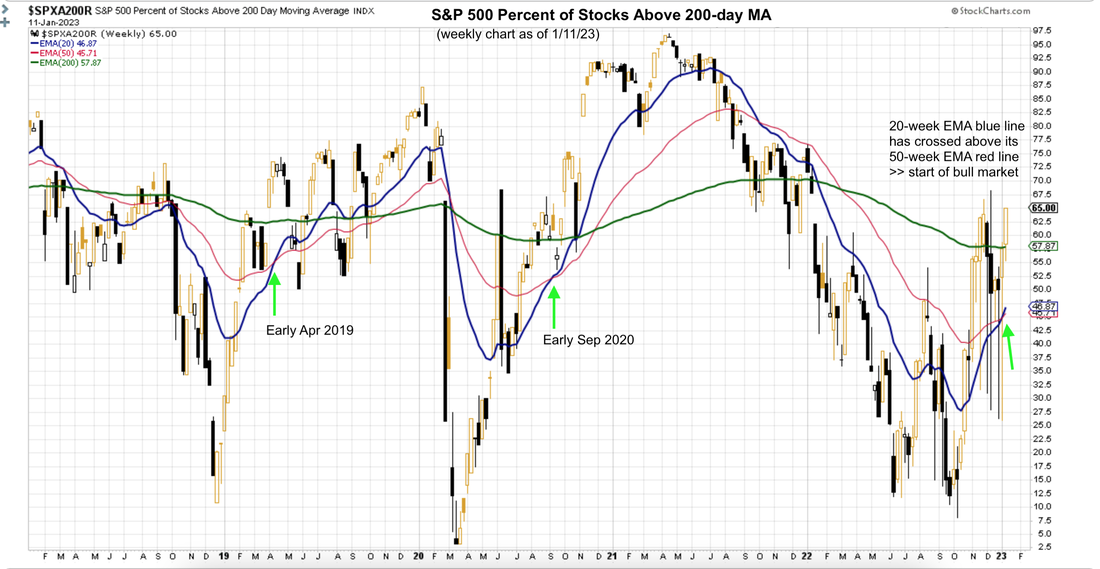 Our Personal Trade Plan We continue to concentrate on scaling into TNA. We think RTY is likely to retest 1815-1830 range. This means TNA is likely to retest the 33.7 - 34.7 range. In the Signal Trades spreadsheet, we have shown our buy orders to scale into TNA in the above price range. Keep in mind that it's very hard to nail the exact numbers. These ranges are meant to give you an idea of where prices are likely to dip to. But we will override everything and manually enter TNA based on what the charts how immediately post CPI. So look for our alerts. Questions? For new members who may not be familiar with the information we post in this blog, please check the glossary for more information. You can also email us with questions directly. Disclaimer The information presented here is our own personal opinion. Consider it as food for thought. We are not offering financial advice. We are not promoting any financial products. We are not registered financial advisers or licensed brokers. We make no guarantee that anything will unfold according to our projections. You are proceeding at your own risk if you follow our trades.
0 Comments
Leave a Reply. |
Archives
February 2024
Categories |
 RSS Feed
|
|
Copyright (c) 2019-2024 LOOK Systems LLC
All rights reserved. |