Updates 11 AM ET - Monday Upcoming key events The key events coming up are actually mid-June, on 6/15 and 6/17. That will be a fairly explosive week, followed by a 3-day weekend. So mark your calendar not to go on vacation during that week. 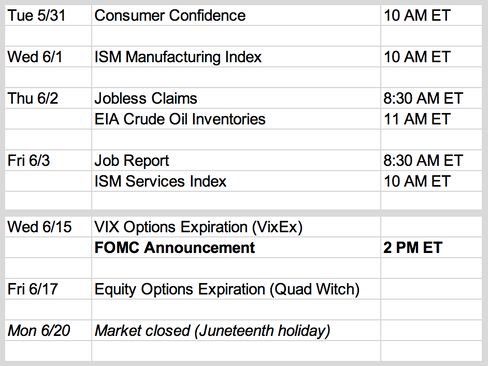 Is this the bottom of the bear market? No one really has the answer for that, but there are some interesting projections by various analysts. The latest projection from Bank of America calls for S&P at 3000 by October, which is a depressingly low number. Below is the daily chart of Nasdaq percentage of stocks above their 200-day MA. This is what we call the percentage of "happy stocks". On 5/20, it got a low as 12%. Historically, when the percentage of "happy stocks" drops below 10%, it is a reliable indication that the bear market has reached capitulation level. 12% is not as clear of an indication. Meanwhile NYSE only got as low as 22%, and small caps got to 17% as the latest low. So we can't say that the bear market has reached capitulation level. This is not good big picture news for the bulls. 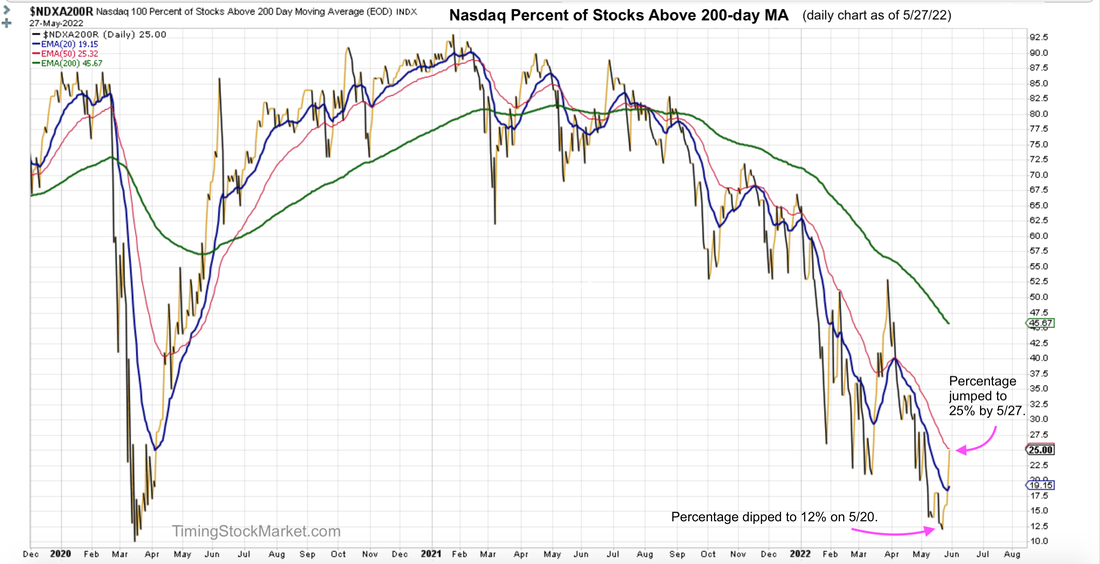 Improving breadth supports bear market rally However, in the short term, bulls should rejoice. The sharp jump in the percentage of "happy stocks" indicates improving breadth.
This is confirmed by the sharply rising Advance/Decline lines for all stock indices as well. Short-term volatility signal: "Fully Bullish" Our volatility signal turned "Fully Bullish" by end of 5/20. That was after a very sharp drop where the S&P dipped into "bear market territory" officially. But volatility charts ($VIX $VXN $RVX $VVIX) all showed that volatility was steadily declining. That was why the volatility signal turned "Fully Bullish". What this demonstrated was the accuracy of our volatility signal. We must confess that even we sometimes have a hard time fully believing it. The bearish sentiments were so strong during the week of 5/16. It can make you doubt your own system. But there is no doubt now that the volatility signal has been right all along. And as of this Friday, it is sending out a bullish message, showing that volatility is not ready to rise yet. 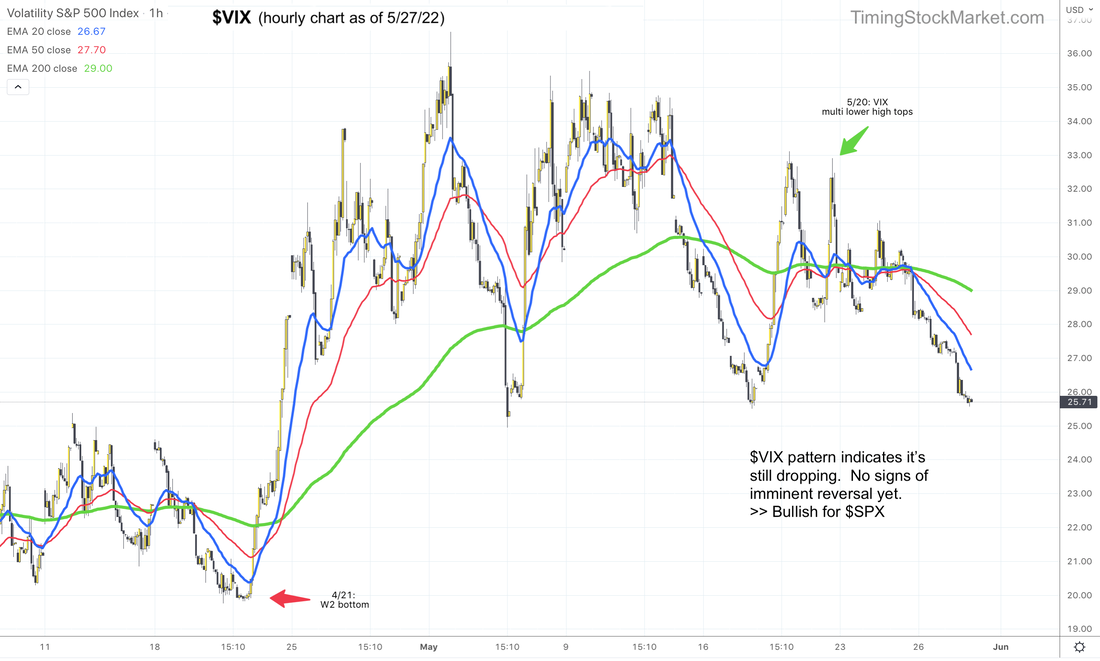 Key support and resistance levels The battle ground for this week will be between these key levels:
(Support is the low of 5/27. Resistance is the high of 5/4.) The bulls have the advantage for now. As long as ES NQ RTY stay above their support levels, they will try to clim up towards resistance. To track their upward progress, use their 15-minute charts to monitor the 200 EMA green line. For example, ES 15-minute chart below, as long as ES 200 EMA green line is still rising, its bullish momentum is still intact. Once this green line starts to go sideway, pay close attention to the message by $VIX and $VVIX. If one of them turns bearish, the volatility signal will become "Transition" at that point. Do note that the resistance levels listed above are very strong. They are where the bulls got trapped post FOMC on 5/4. So a lot of sellers are likely to step in at this level. 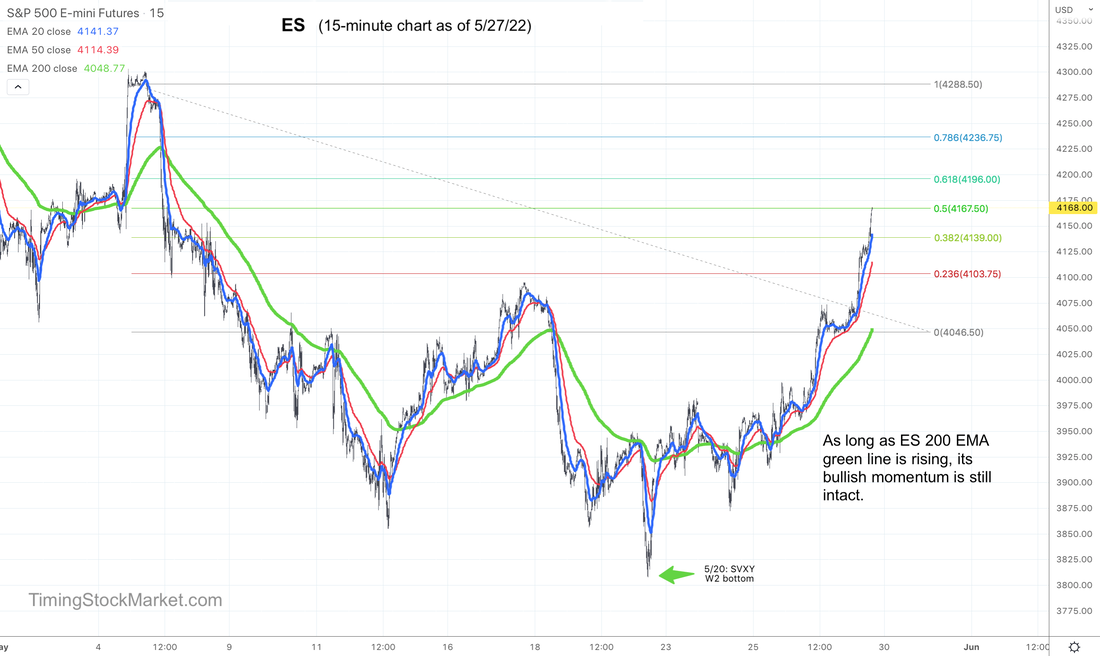 Trade plan Click here for live trades. Subscribe to get our latest analysis, daily trade plans and live intraday trades. Current trade record here. Disclaimer The information presented here is our own personal opinion. Consider it as food for thought. We are not offering financial advice. We are not promoting any financial products. We are not registered financial advisers or licensed brokers. We make no guarantee that anything will unfold according to our projections. You are proceeding at your own risk if you follow our trades.
0 Comments
Leave a Reply. |
Archives
July 2024
Categories |
 RSS Feed
|
|
Copyright (c) 2019-2024 LOOK Systems LLC
All rights reserved. |