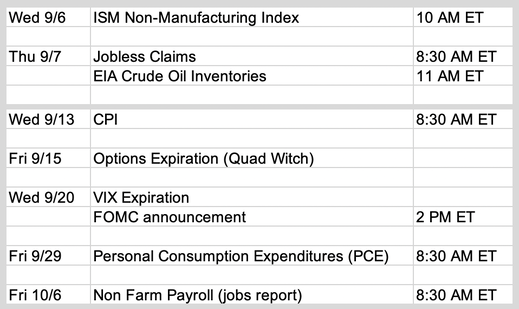
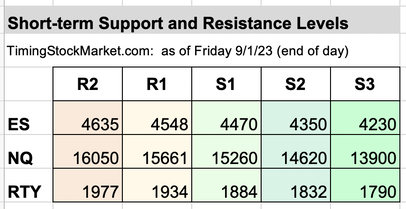
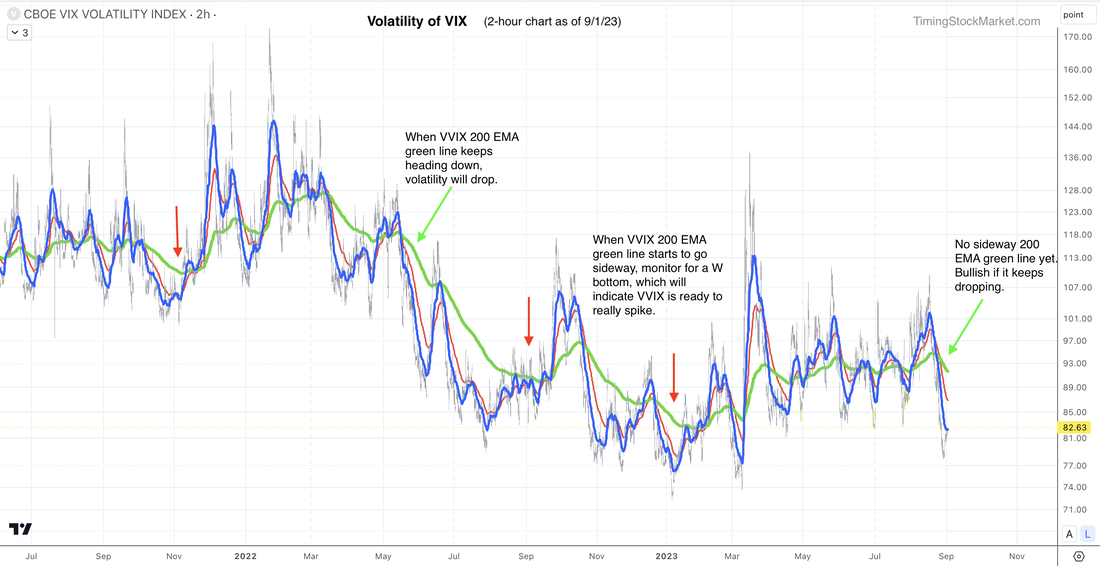
Updates 6:30 PM ET - Tuesday Exit remaining 1/2 SVIX position VIX is most likely going to base in the zone 13 - 14.5 until mid Sep. But there’s a chance VIX might just spike sharply just to shake out the weak hands like it did on Jul 6. We don't want to endure the possibility of a sudden VIX spike now that volatility pattern is becoming more unpredictable. So we decided to exit the remainder of our SVIX position for now. You can review the original analysis, setup and entry into this trade here, and the partial profit here. Updates 12:16 PM ET - Tuesday Warnings to bulls: VIX is basing to rise VIX along with VIX futures (VX1!) and volatility of VIX (VVIX) are starting to form a pattern indicating they are basing to rise. They may continue to do this until FOMC on Sep 20 when they may spike up. VIX may spike up to the zone 18-19, or it may rise as high as 22. We won't be able to judge until it gets closer. S&P and Nasdaq percent of stocks above 200-day MA (Stockcharts: $SPXA200R $NDXA200R) are dropping as expected. Let's see if they can find support at their recent lows. We are raising the stop on our 1/2 SVIX position to ensure that we lock in more profit if market conditions change suddenly. However, we are not entering into bear positions such as UVXY or SQQQ yet. Updates 6:50 PM ET - Monday Upcoming key events This week is very light in economic data. But next week promises plenty of fireworks. Read more economic analysis here. Key S/R levels ES NQ RTY successfully penetrated their R1 levels from Friday. So we have tweaked the R1 levels a bit, along with S1. ES NQ RTY are likely to chop below R1 early this week, possibly dropping down to tag the new S1 before resuming the climb to penetrate the new R1, possibly by Friday. Can they rise to R2 soon? Read more about that further below. Big picture outlook: Bull is still in charge We've been discussing VIX and market breadth charts. So let's zoom out and take a look at the indicator that typically gives warnings way in advance: VVIX (volatility of VIX). The 2-hour chart of VVIX below shows the types of patterns to look for. Keep an eye on VVIX 200 EMA green line.
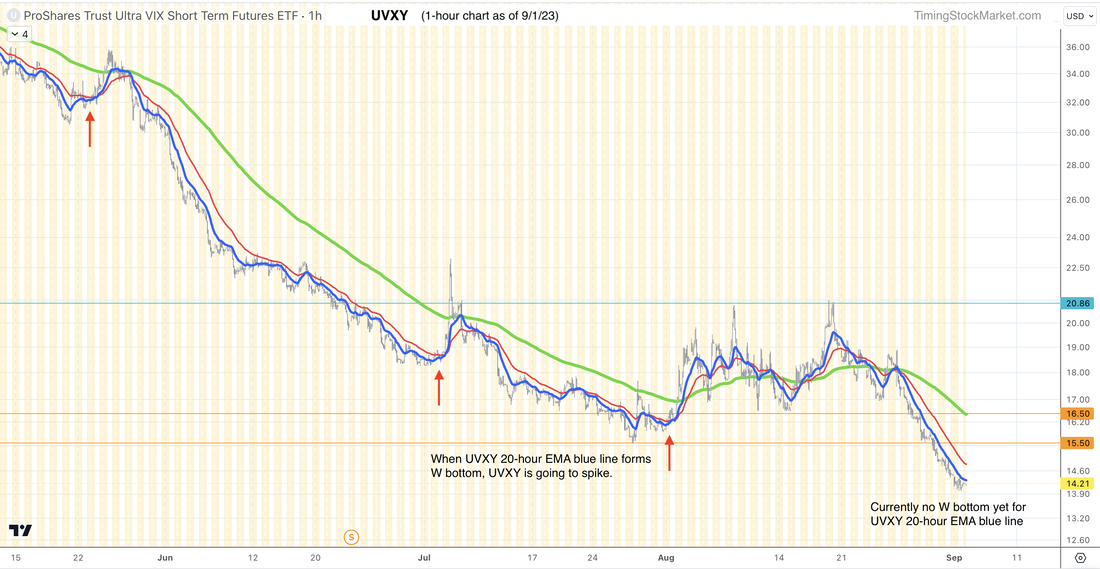
Right now, VVIX 200 EMA green line is dropping. So we expect the current bullish conditions to continue. Another chart that is useful for quick check is UVXY. UVXY rises as VIX rises, and drops as VIX drops, only more so due to contango. Think of contago as very strong head wind that pushes UVXY down steadily. So the time to really worry about the bear is when UVXY 20-hour EMA blue line starts to form a W bottom (or V or U). Take a look at examples of these patterns in the chart below, marked with red arrows. As you can see, UVXY is not showing the worrisome W bottom yet. So bulls can breath a sigh of relief for now. This week: Bulls should pray for a quick sharp pullback to recharge strength That said, ES NQ RTY are stalling out in their rise, stuck right at R1. Bulls should hope for a quick sharp pullback early in the week to help the bull recharge its strength. Here is the bullish setup bulls would want to see.
If we get this setup and get a shallow dip for ES NQ RTY this week, the bull is possibly recharged enough to reach R2 by FOMC on Sep 20. Our personal trade plan Per our analysis last weekend, we scaled into SVIX on Aug 28. And per our analysis on Aug 31, we took partial profit on 1/2 SVIX position. At this point, we are waiting for the bullish setup discussed above to show up before scaling back into SVIX. In the spreadsheet, we've shown our new buy orders. Click here for Signal Trades spreadsheet. Disclaimer The information presented here is our own personal opinion. Consider it as food for thought. We are not offering financial advice. We are not promoting any financial products. We are not registered financial advisers or licensed brokers. We make no guarantee that anything will unfold according to our projections. You are proceeding at your own risk if you follow our trades.
0 Comments
Leave a Reply. |
Archives
July 2024
Categories |


 RSS Feed