Updates 11:40 AM ET - Friday Entered into SVIX As we wrote earlier today, we want to capture VIX dropping from 14.49 down to 11.8. So we entered SVIX earlier this morning. This is a quick bull trade as VIX is possibly undergoing a big basing period. 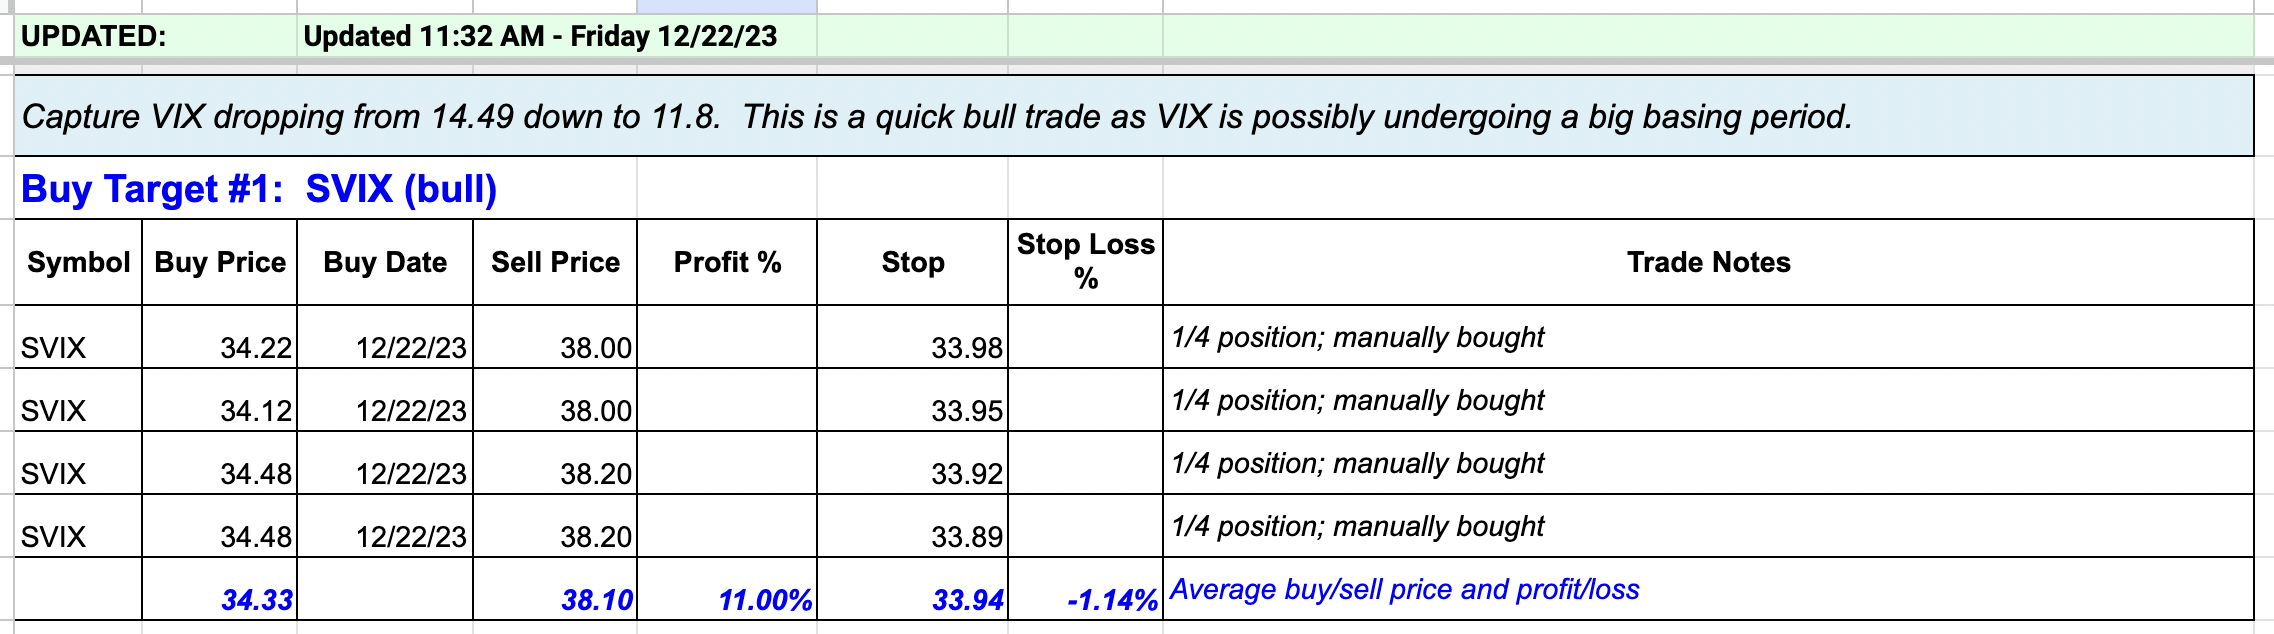 Updates 12:45 AM ET - Friday Upcoming key events According to WSJ, inflation is closing in on the Fed’s target. Read more about what to expect for Friday's PCE report here. 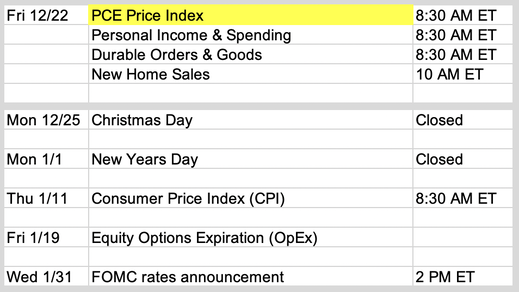 Key S/R levels All levels are still the same. 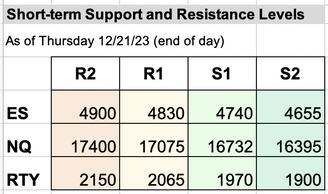 VIX woke up and is now the leading indicator Before Wed Dec 20, we shared charts which showed warnings of an upcoming dip for ES NQ RTY. These are the warnings that came true on Wednesday.
VIX has woken up at last. We now can use it as the leading indicator to guide us for the next few weeks. We have been writing about VIX spiking up to 14.3 for the short term. It rose to 14.49 on Thu Dec 21. We think that is VIX top for now until early Jan. We expect VIX to drop on from 14.49 high to retest 11.8 again between now and the first week of Jan. While VIX drops, McClellan Oscillator (Stockcharts.com $NYMO) is likely to grind downward but still stay positive. With this confirmation, ES NQ RTY should recover and likely to surpass resistance at R1 as part of the Santa Claus rally. This could start as early as Fri Dec 21 and may last into the first week of Jan. Once VIX drops down to 11.8, if it anchors at this level and starts to rise, VIX can reach as high as 15.5. If McClellan Oscillator swings negative also, then ES NQ RTY will drop and may retest support at S2. However, if VIX continues to drop below 11.8, then ES NQ RTY will spike up to resistance at R2. Our personal trade plan We now want to capture VIX dropping from 14.49 down to 11.8 via SVIX. Then if VIX anchors at 11.8 and then starts to rise, we'll aim to capture the rise in VIX from 11.8 to 15.5 with UVXY. Click here for Signal Trades spreadsheet. Disclaimer The information presented here is our own personal opinion. Consider it as food for thought. We are not offering financial advice. We are not promoting any financial products. We are not registered financial advisers or licensed brokers. We make no guarantee that anything will unfold according to our projections. You are proceeding at your own risk if you follow our trades.
0 Comments
Updates 2:45 AM ET - Monday Upcoming key events This week is light on economic news, but Powell is scheduled to speak twice at two different economic conferences. Given the latest softer jobs report, traders are likely to monitor his remarks closely for any hints of "no more rate raises". As we know, the stock market is currently driven by bond yields. According to WSJ: "Yields, which fall when bond prices rise, were also pulled lower by soft economic dataand hints from the Federal Reserve that it likely won’t raise interest rates again this year. But it was the Treasury move that many saw as the crucial catalyst." What is this Treasury move and what about the soft economic data? Read more here.  Is the bear market trend done? The WSJ article pointed out that Treasury yields dropped last week from:
Market breadth (Stockcharts.com $SPXA200R $NDXA200R) continues to show big-picture bearishness. The weekly chart of S&P percent below shows all of its EMA lines to dropping sharply. 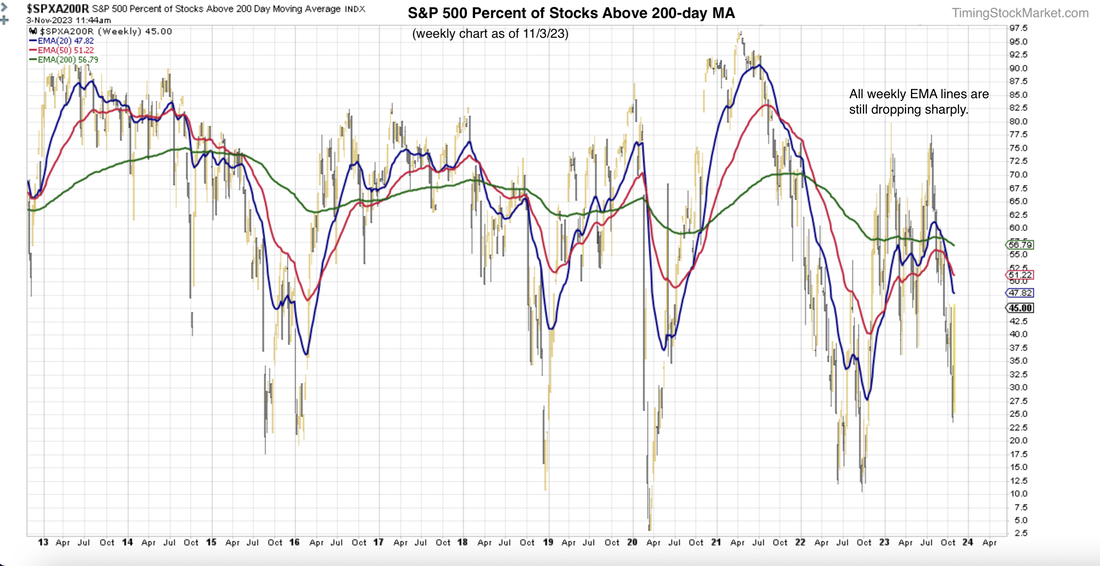 Bounce has lasted 6 trading days. How much longer can it last? The hourly chart of Nasdaq Advance-Decline Percent below shows that it has reached into very overbought category. But it has not formed a top yet. The same is true for S&P A/D Percent chart. We want to see some kind of top formation like August 30 - September 1 top formation shown below. This chart is just starting a possible topping process. Bears should give it time. Wait at least until the 20-hour EMA green line crosses below the 50-hour EMA red line. 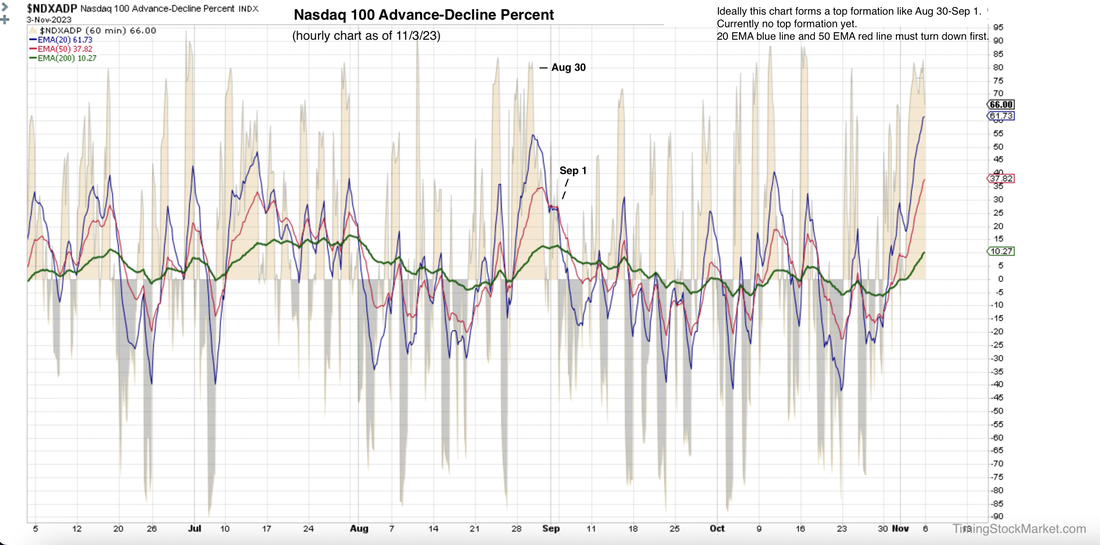 The daily chart of VVIX (volatility of VIX) shows that it has dropped into the bottoming zone. But it is only starting to form the bottom. It can take up to 2 weeks before it's done with the process. So again, bears should wait until VVIX 20-day EMA blue line drops below its 200-day EMA green line and gets down closer to its candles. 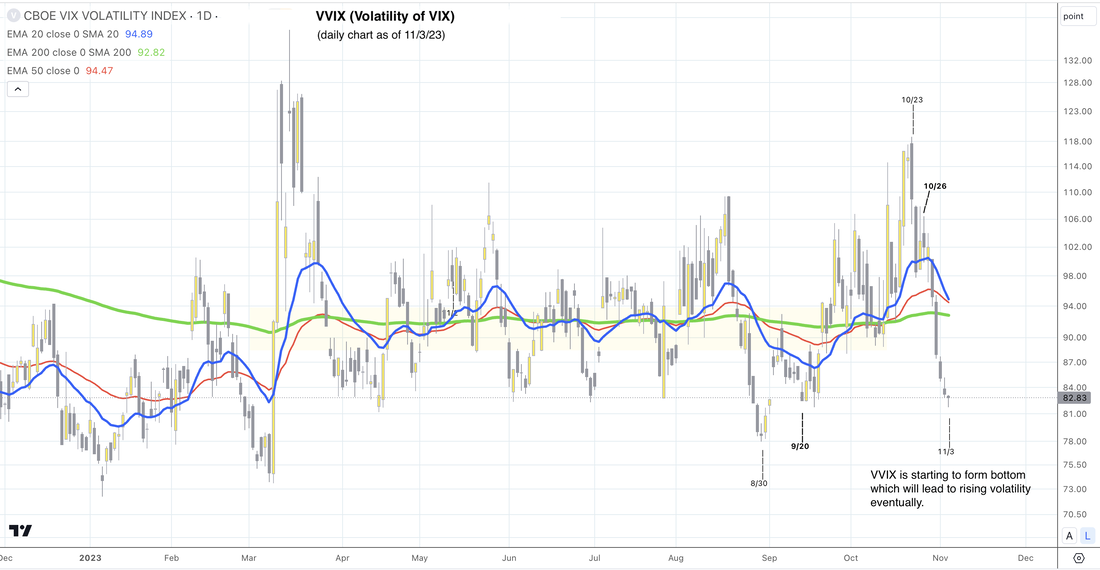 Bear market has a way of luring bulls in with its big sharp bullish reversals. These very sharp rises typically come from massive short covering by dealers who previously sold puts (bullish) and had to short stock futures (bearish) to balance their books. When the buying starts, these dealers have to unload the massive inventory of shorts. The result is a short squeeze. The way to trade this market is to trade the bear market selloff, and trade the relief bounce, but don't get married to either direction. You don't have to buy into the "bear market" label. Just trade the big swings. Key S/R levels The updated levels are shown in bold. Bulls will actually want to see ES NQ RTY retest S1 again, and find strong support. In that case, the setup may bring in enough buyers to send ES NQ RTY up to R2, or possibly higher. If ES NQ RTY try to surpass R1 quickly, they are likely to fail and it will be a steep drop down to S2. 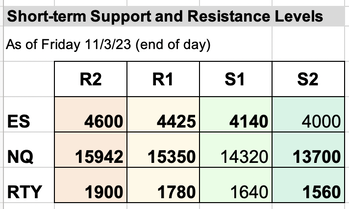 Our personal trade plan Subscribe to get our daily analysis, trade plans and real-time entries/exits. Disclaimer The information presented here is our own personal opinion. Consider it as food for thought. We are not offering financial advice. We are not promoting any financial products. We are not registered financial advisers or licensed brokers. We make no guarantee that anything will unfold according to our projections. You are proceeding at your own risk if you follow our trades.
Updates 6:30 PM ET - Tuesday Exit remaining 1/2 SVIX position VIX is most likely going to base in the zone 13 - 14.5 until mid Sep. But there’s a chance VIX might just spike sharply just to shake out the weak hands like it did on Jul 6. We don't want to endure the possibility of a sudden VIX spike now that volatility pattern is becoming more unpredictable. So we decided to exit the remainder of our SVIX position for now. You can review the original analysis, setup and entry into this trade here, and the partial profit here. 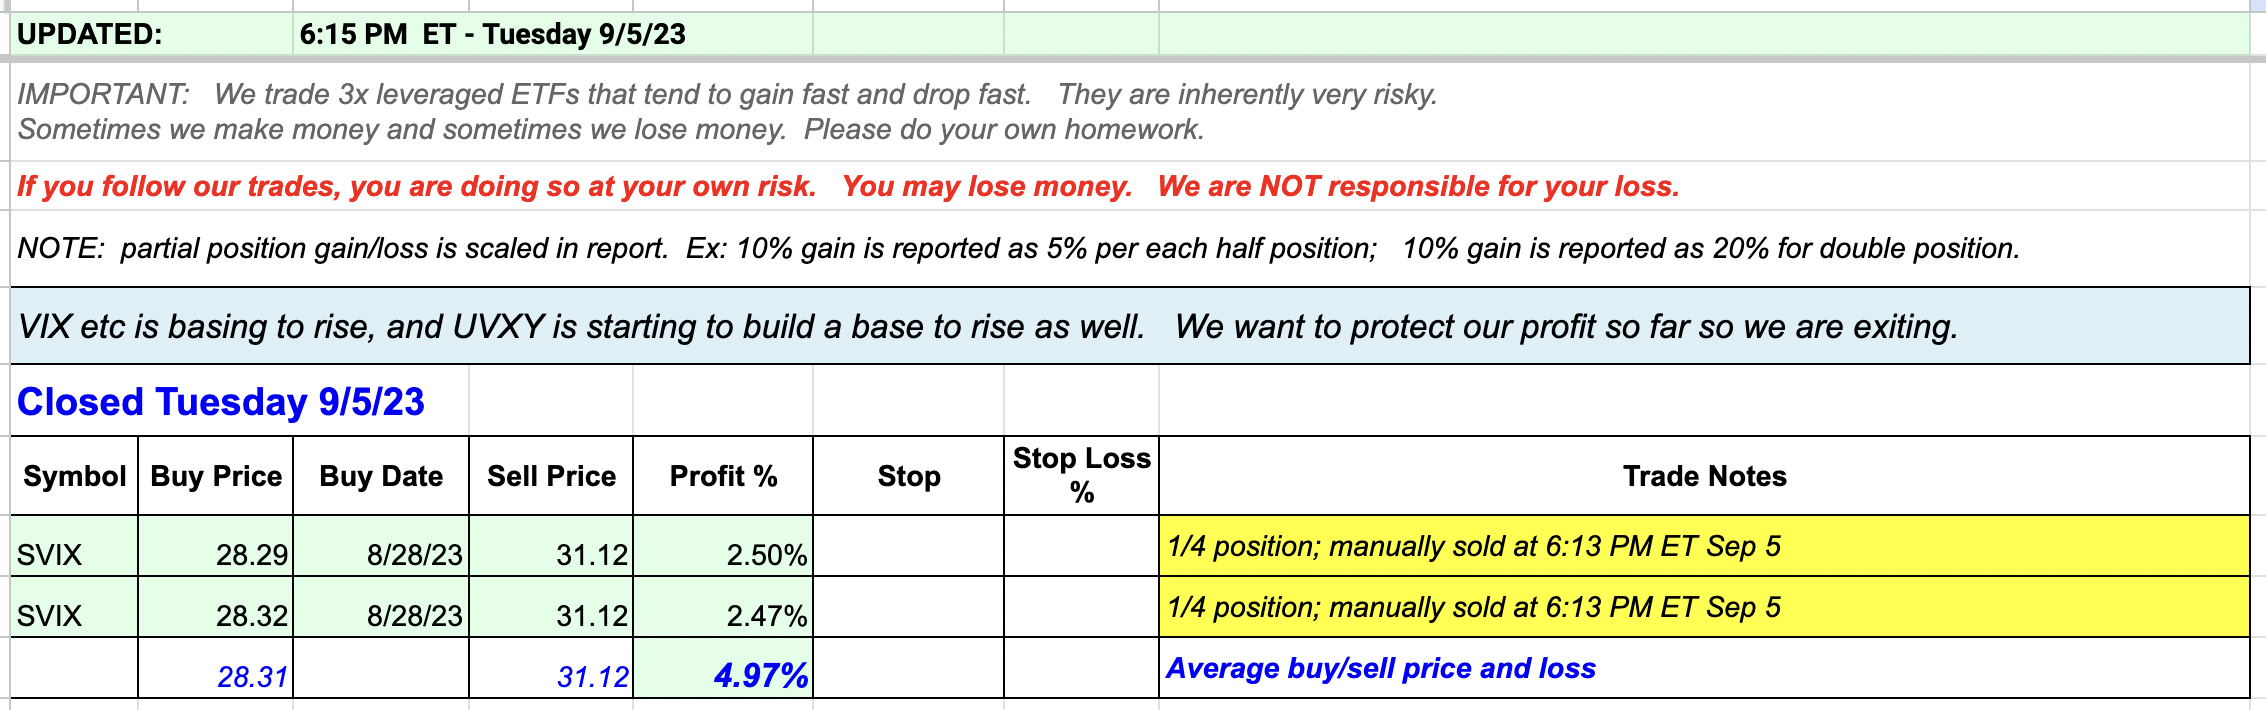 Updates 12:16 PM ET - Tuesday Warnings to bulls: VIX is basing to rise VIX along with VIX futures (VX1!) and volatility of VIX (VVIX) are starting to form a pattern indicating they are basing to rise. They may continue to do this until FOMC on Sep 20 when they may spike up. VIX may spike up to the zone 18-19, or it may rise as high as 22. We won't be able to judge until it gets closer. S&P and Nasdaq percent of stocks above 200-day MA (Stockcharts: $SPXA200R $NDXA200R) are dropping as expected. Let's see if they can find support at their recent lows. We are raising the stop on our 1/2 SVIX position to ensure that we lock in more profit if market conditions change suddenly. However, we are not entering into bear positions such as UVXY or SQQQ yet. Updates 6:50 PM ET - Monday Upcoming key events This week is very light in economic data. But next week promises plenty of fireworks. Read more economic analysis here. 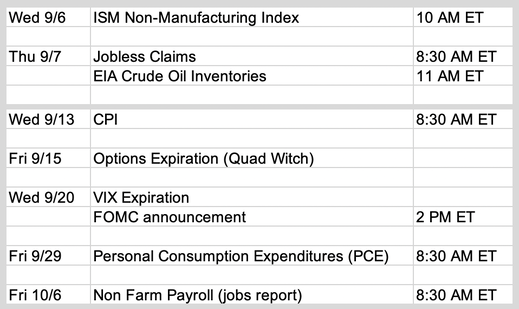 Key S/R levels ES NQ RTY successfully penetrated their R1 levels from Friday. So we have tweaked the R1 levels a bit, along with S1. ES NQ RTY are likely to chop below R1 early this week, possibly dropping down to tag the new S1 before resuming the climb to penetrate the new R1, possibly by Friday. Can they rise to R2 soon? Read more about that further below. 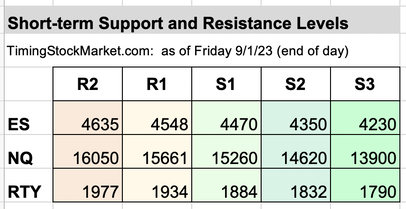 Big picture outlook: Bull is still in charge We've been discussing VIX and market breadth charts. So let's zoom out and take a look at the indicator that typically gives warnings way in advance: VVIX (volatility of VIX). The 2-hour chart of VVIX below shows the types of patterns to look for. Keep an eye on VVIX 200 EMA green line.
Right now, VVIX 200 EMA green line is dropping. So we expect the current bullish conditions to continue. 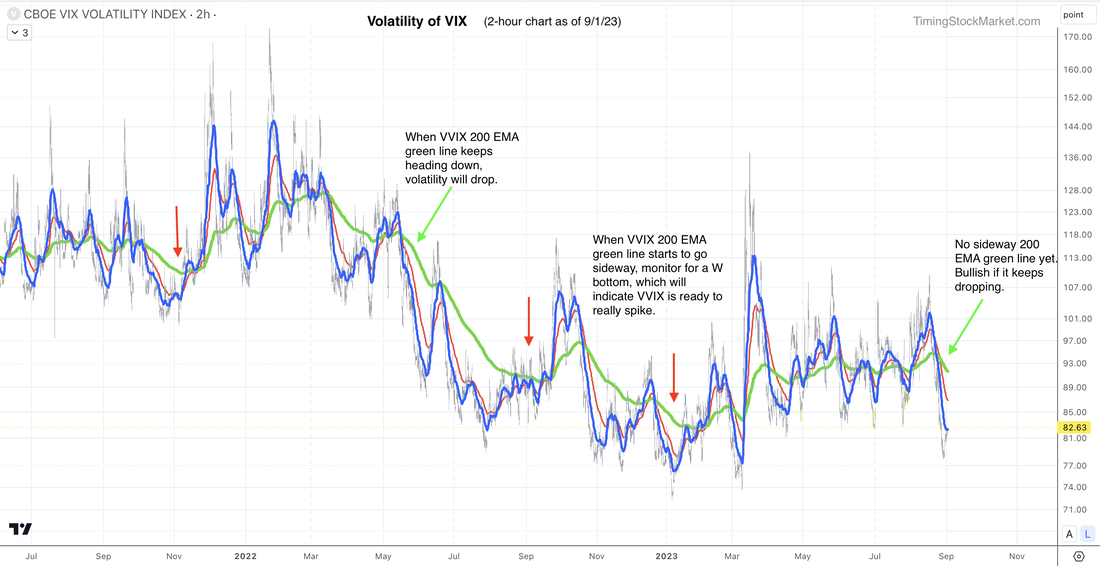 Another chart that is useful for quick check is UVXY. UVXY rises as VIX rises, and drops as VIX drops, only more so due to contango. Think of contago as very strong head wind that pushes UVXY down steadily. So the time to really worry about the bear is when UVXY 20-hour EMA blue line starts to form a W bottom (or V or U). Take a look at examples of these patterns in the chart below, marked with red arrows. As you can see, UVXY is not showing the worrisome W bottom yet. So bulls can breath a sigh of relief for now. 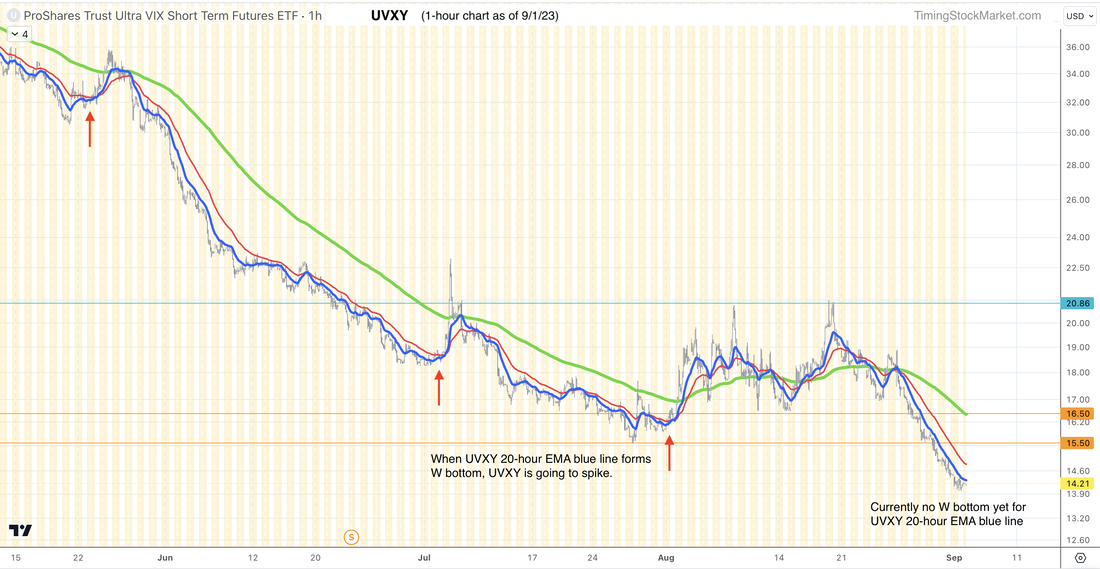 This week: Bulls should pray for a quick sharp pullback to recharge strength That said, ES NQ RTY are stalling out in their rise, stuck right at R1. Bulls should hope for a quick sharp pullback early in the week to help the bull recharge its strength. Here is the bullish setup bulls would want to see.
If we get this setup and get a shallow dip for ES NQ RTY this week, the bull is possibly recharged enough to reach R2 by FOMC on Sep 20. Our personal trade plan Per our analysis last weekend, we scaled into SVIX on Aug 28. And per our analysis on Aug 31, we took partial profit on 1/2 SVIX position. At this point, we are waiting for the bullish setup discussed above to show up before scaling back into SVIX. In the spreadsheet, we've shown our new buy orders. Click here for Signal Trades spreadsheet. Disclaimer The information presented here is our own personal opinion. Consider it as food for thought. We are not offering financial advice. We are not promoting any financial products. We are not registered financial advisers or licensed brokers. We make no guarantee that anything will unfold according to our projections. You are proceeding at your own risk if you follow our trades.
Updates 5:15 PM ET - Monday Scaled into bull position SVIX Per our analysis last night, we scaled in when SVIX dipped in the morning. Our target for this trade is 10% gain. 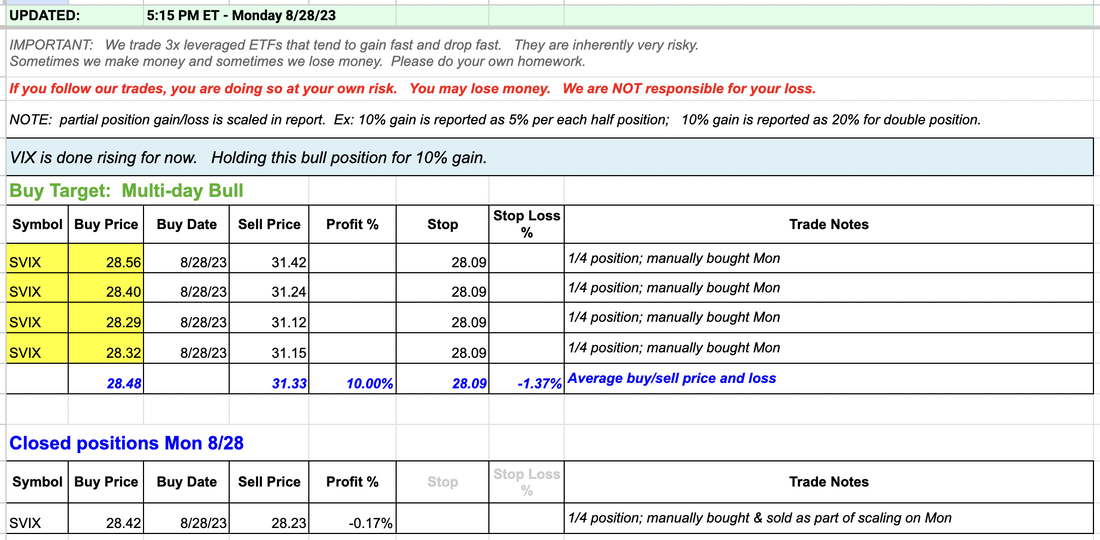 Updates 12:50 AM ET - Monday Upcoming key events This week is filled with economic data that is likely to move the market sharply. 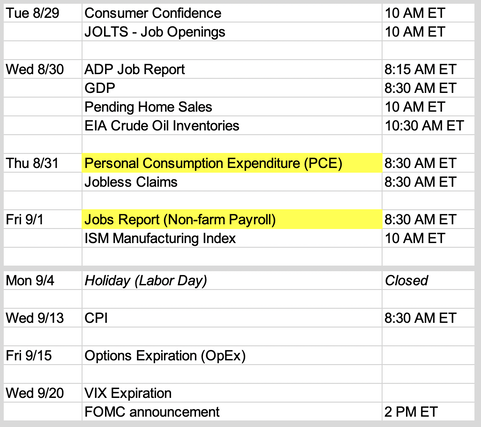 Big picture outlook: Da bull is back? In preparation for Aug 21, we shared with you a big picture analysis. We were worried about VVIX (volatility of VIX) forming the dreaded "Coiling Towards Catastrophe" pattern on its weekly chart. Market breadth confirmed this bearishness by continuing to drop. By end of day Aug 25, a different picture emerged, one that is much more bullish. Let's take a look at the indicators. Market breadth charts formed W bottom >> bullish support By Friday, the 15-minute charts of S&P and Nasdaq percent of stocks above 200-day MA ((Stockcharts: $SPXA200R $NDXA200R) showed a clear W bottom. S&P grazed 50%, and Nasdaq grazed 62%. They both then stabilized and turned up. This suggests that stocks may be done with the big drop for now. 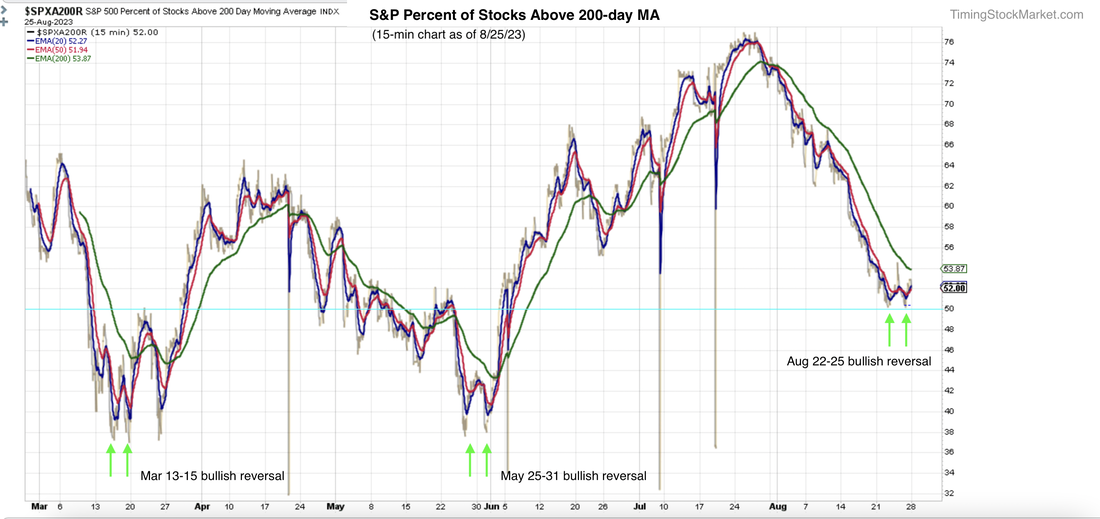 "Coiling Towards Catastrophe" signal failed >> bullish support For last Monday, we wrote an in-depth explanation about the big bearish signal from VVIX which we dubbed "Coiling Towards Catastrophe". By end of week on Friday Aug 25, this signal failed to materialize. VVIX 20-week EMA blue line failed to cross over the 50-week EMA red line. A key failed signal is always significant. It is saying that there is not that much volatility in the system to push VIX into the stratosphere. Not anytime soon. And after a good size sell-off, a failed bear signal is a healthy bull signal.  VIX may be forming a topping pattern >> bullish support VIX has formed a lower high pattern relative to Aug 18 peak. If VIX continues this pattern and its 20-day EMA blue line drops below its 50-day EMA red line, then VIX is on its way possibly to 13 or lower. 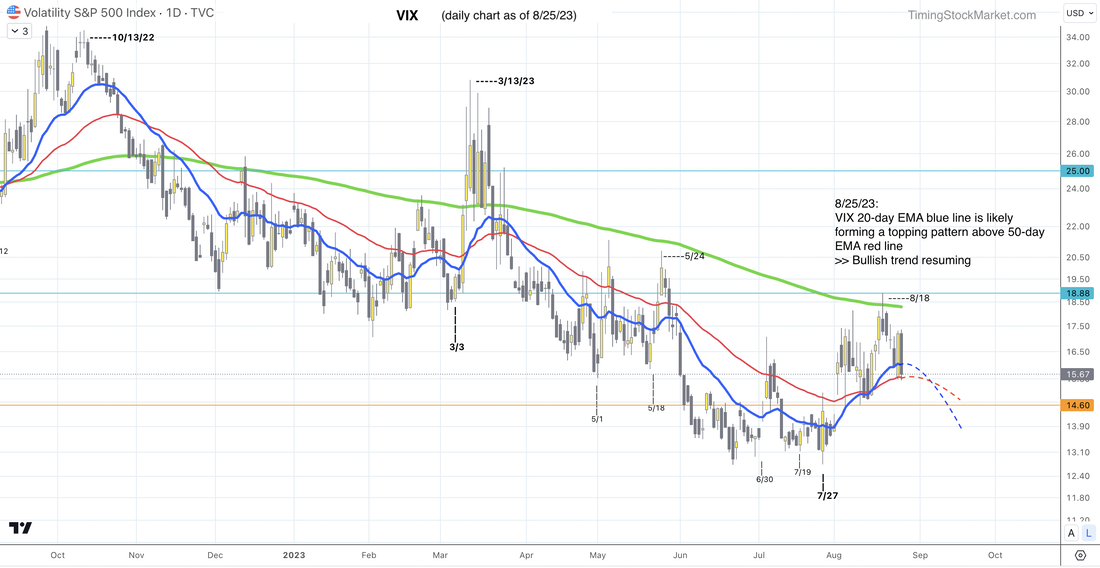 How long will the bull signals last? Here are the key signals that we'll be monitoring to confirm that the bull is back in charge.
If these signals start to fail, then the bull may be in trouble again. But we suspect that market will calm down between now and about mid-September. Then we may see a setup for a bearish volatility surge. However, at this point we are not sure if this September surge will send VIX above 19. If VVIX keeps grinding downward, then conditions will still lean bullish. But if VVIX anchors and starts to rise, then the bear is likely back and may come back with a vengeance. Key S/R levels All R1 and R2 lelvels have been updated. Support levels remain the same. If ES NQ RTY retest or get close to S1, that may be a decent setup to enter bull positions. They are likely to reach R1 if bullish conditions persist. They may even rise all the way to R2 by mid September.  Our personal trade plan We will be looking for a bullish setup to enter SVIX on Monday. See our buy orders in the spreadsheet. Click here for Signal Trades spreadsheet. Disclaimer The information presented here is our own personal opinion. Consider it as food for thought. We are not offering financial advice. We are not promoting any financial products. We are not registered financial advisers or licensed brokers. We make no guarantee that anything will unfold according to our projections. You are proceeding at your own risk if you follow our trades.
Updates 5:47 PM ET - Monday 8/14/23 Opened new position: multi-day bull We entered into TQQQ as outlined in our trade plan earlier today. Entered just above the low of the day. This TQQQ trade aims to capture the anticipated relief rally where NQ can rise from 15000 to 15610 (S1 to R1). 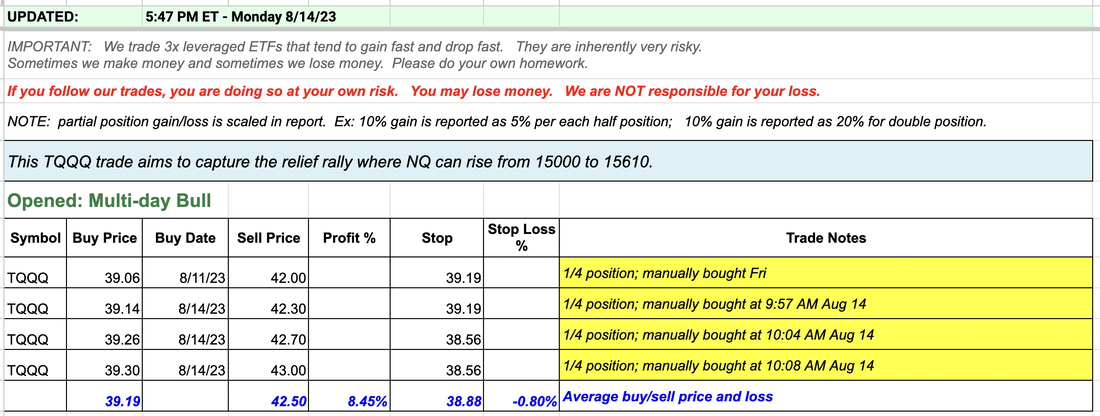 Updates 12:50 AM ET - Monday 8/14/23 Upcoming key events Most of this week will be quiet until Wednesday and Friday. Read more economic analysis here. 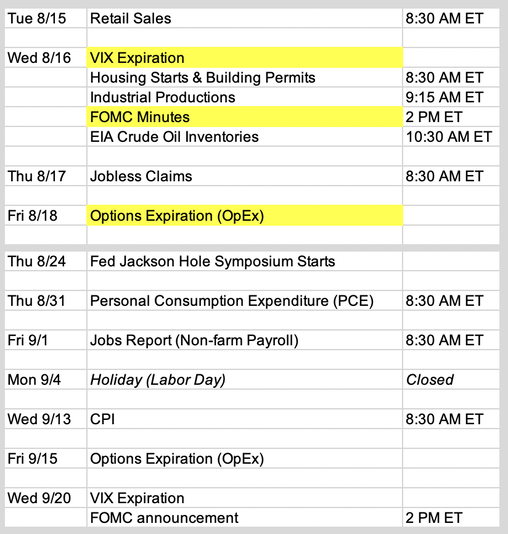 Earnings this week Chart courtesy of Earnings Whispers. 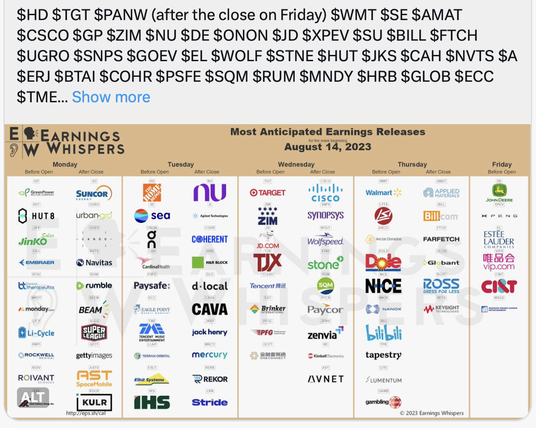 Multi-month outlook: Bull market is still intact but needs recharging Our multi-month indicators show the bull market is still intact, but its strength is waning a bit. It will take multiple weeks of recharging to get this bull back close to full strength. If we have a big VIX fear spike in September, then this bull may be recharged enough to run through the first quarter of 2024. 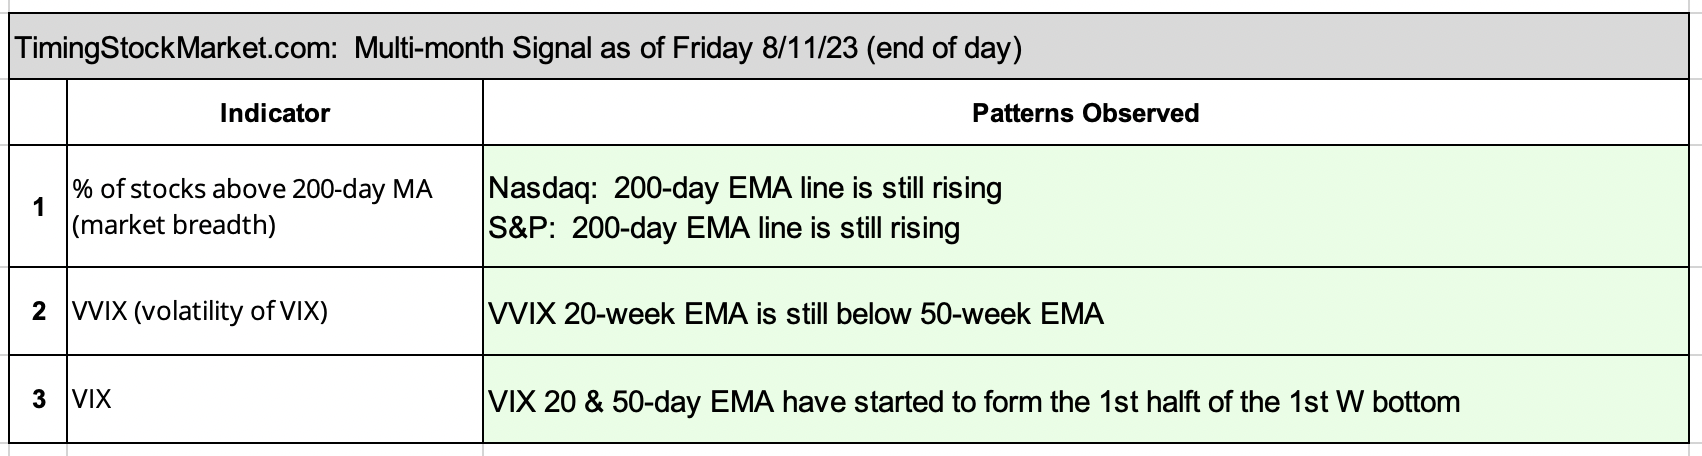 Calming messages from volatility and breadth VIX daily chart below shows that it has been forming a top consisting of lower high candles since Aug 4. This suggests that VIX is more likely to drop in the short term rather than rise. 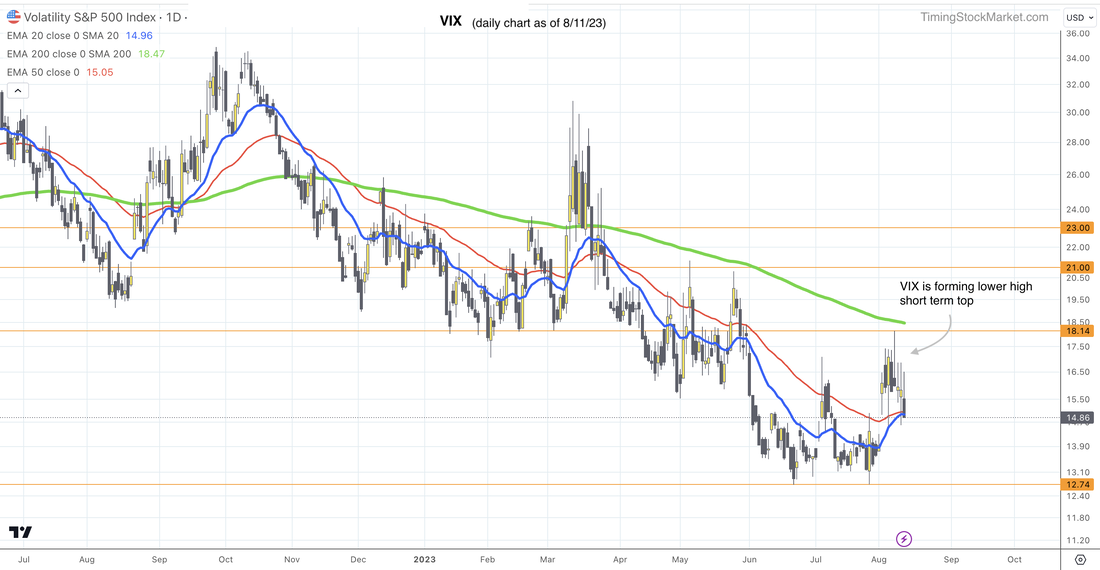 The hourly chart of S&P Advance-Decline Percent below shows a clear W bottom has been formed. These W bottoms suggest that more stocks are able to advance rather than before. 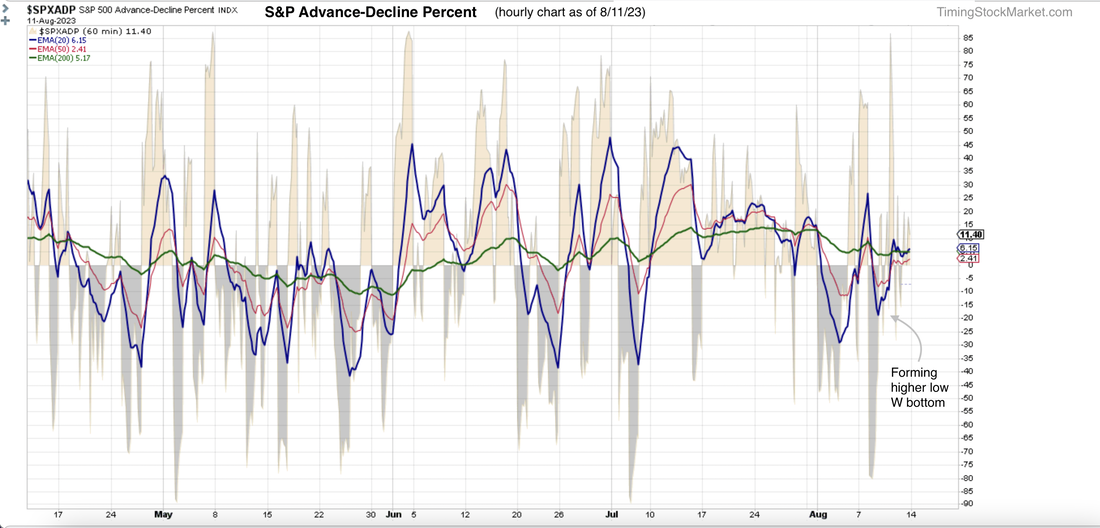 The S/R table below has all the support levels lowered. 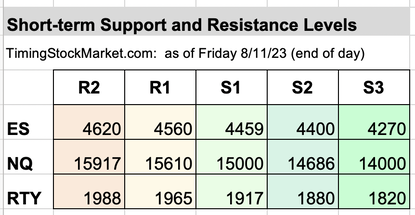 Short-term outlook: Relief rally likely coming this week Right now market flow is very bearish:
If there is a big immediate negative catalyst, this bearish setup will create a vicious cycle of selling. We will see VIX surge hugely, while ES NQ RTY dive sharply. However, all of these bets are time sensitive. VIX expiration is this Wednesday, and equity expiration is this Friday. Most of these bearish bets will expire worthless if we don't get a big immediate negative catalyst. The calming messages from VIX and A/D Percent tell us that nothing super scary is on the horizon right now. As expiration approaches with no big bad bearish catalyst, traders will unwind their bets, and dealers will have to reverse their books, swinging over to the bullish side. This provides fuel for a short squeeze where EQ NQ RTY may rise sharply, creating a virtuous cycle in the process. This relief rally may enable ES NQ RTY to rise from S1 up to R1. They may even try to climb as high as R2, but they are very unlikely to surpass R2 for now. The Fed Jackson Hole Symposium starts on Aug 24. You may recall that last Aug, Jerome Powell's opening speech killed the relief rally in late Aug and sent the market down for another bearish leg. We may see a similar pattern at this year's symposium. We don't think a fear spike will show up until closer to that big window of weakness between Sep 15 and Sep 21 (see schedule of key events above). During this period, VIX may rise as high as 22-23, and ES NQ RTY may dip as low as S3. The good news is this fear spike should recharge the bull for another run through the first quarter of 2024. Our inner bull is hoping for this scenario to come true so that we can enter multi-month and multi-week bull positions. Our personal trade plan We have started to scale into TQQQ to capture the relief rally where NQ can rise from 15000 to 15610. After the relief rally, we are likely to see more selling. We want to wait for VIX to drop into the zone 13.5 - 14 and SQQQ to retest the zone 17 - 17.5 before entering SQQQ. This SQQQ trade aims to capture NQ dropping again from 15610 to 14686. Click here for Signal Trades spreadsheet. Disclaimer The information presented here is our own personal opinion. Consider it as food for thought. We are not offering financial advice. We are not promoting any financial products. We are not registered financial advisers or licensed brokers. We make no guarantee that anything will unfold according to our projections. You are proceeding at your own risk if you follow our trades.
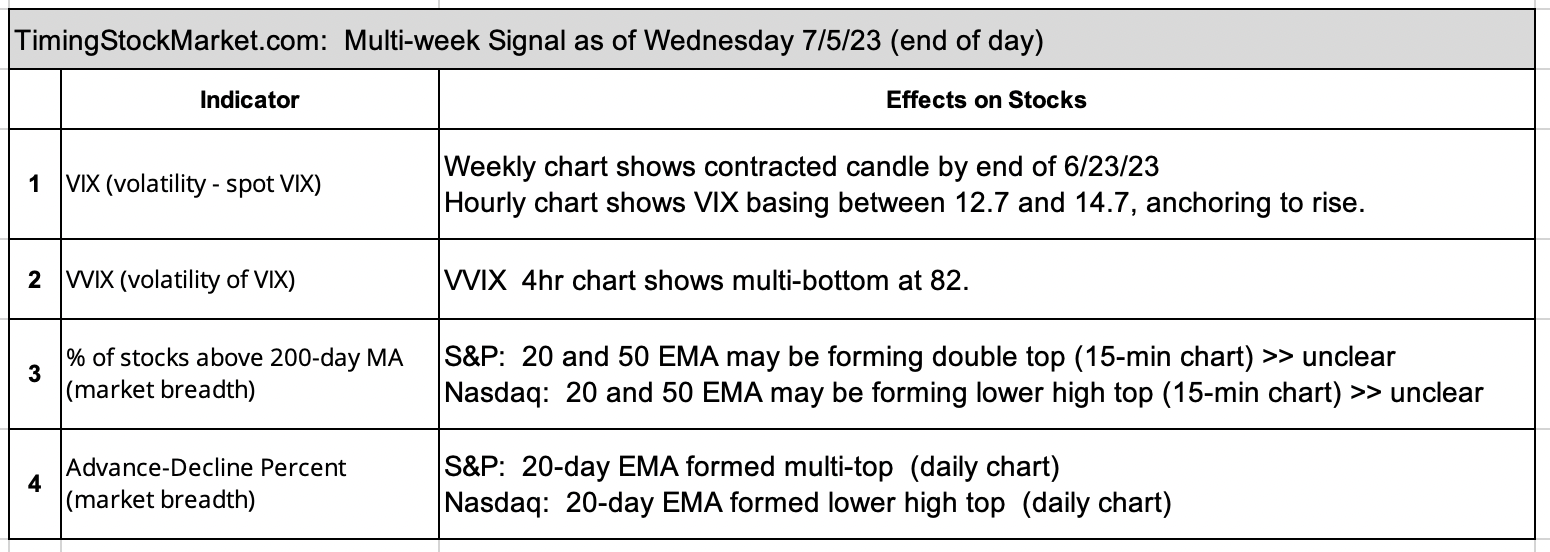
Updates 1:45 AM ET - Thursday 7/6/23 Multi-month bull signal intact The four key indicators below tell us that the bull market that started last October remains intact. There is no setup for a crash or even a massive pullback right now. 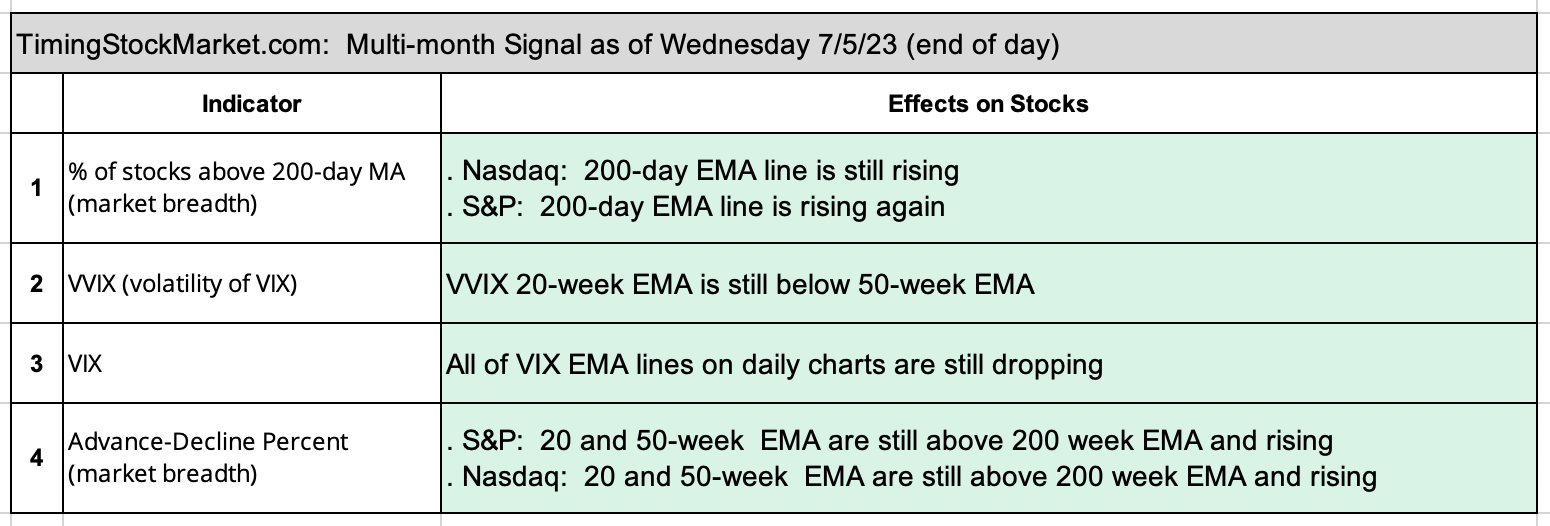 Multi-week bull signal is fading All 4 indicators below are now saying "no longer supportive of multi-week bull". Therefore:
 Key S/R levels All RTY levels in the S/R table below have been updated. The others remain the same Yesterday, we wrote: "Since the multi-week bull signal has faded, ES NQ RTY are vulnerable to a pullback." Wednesday brought the start of the pullback, most evident in RTY. We expect ES and NQ to follow in RTY footsteps down. None of them seems capable of pushing through R1 in the short term. ES NQ RTY are likely to dip down to S1 while VIX rises up to the zone 17-18. Then we may see the start of a new multi-week bull that can take ES NQ RTY from support at S1 up to R2. 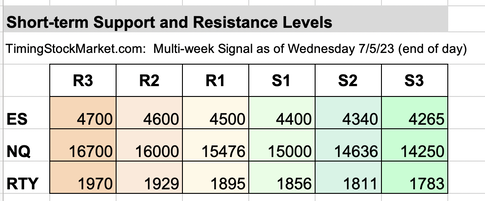 Our personal trade plan No more quick bull trade for now. We've shared the setup for a multi-day bear trade via TZA. Click here for Signal Trades spreadsheet. Disclaimer The information presented here is our own personal opinion. Consider it as food for thought. We are not offering financial advice. We are not promoting any financial products. We are not registered financial advisers or licensed brokers. We make no guarantee that anything will unfold according to our projections. You are proceeding at your own risk if you follow our trades.
Updates 2 PM ET - Monday Upcoming key events There is a moderate amount of market events this week. Powell is scheduled to speak starting on Wednesday in his semiannual report to Congress.  Earnings this week Chart courtesy of Earnings Whispers. 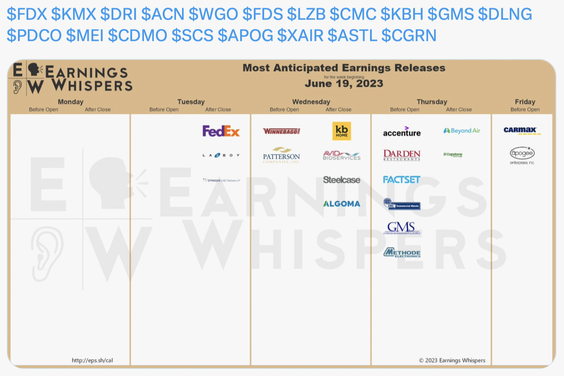 Multi-week Signal Indicators: Bullish Our two key indicators below tell us that the bull market is still intact. In the big picture context, ES NQ RTY along with SVIX SVXY will remain in bullish trend until both of these indicators below change. If only one indicator changes to bearish, then equities may be transitioning, but they don't turn bearish instantly. Note that when we say "turn bearish" for the multi-week signal, we don't mean just a dip. When these two signals below turn bearish, it means the big-picture multi-month bull trend is done. Market will then transition to some variety of bear market. 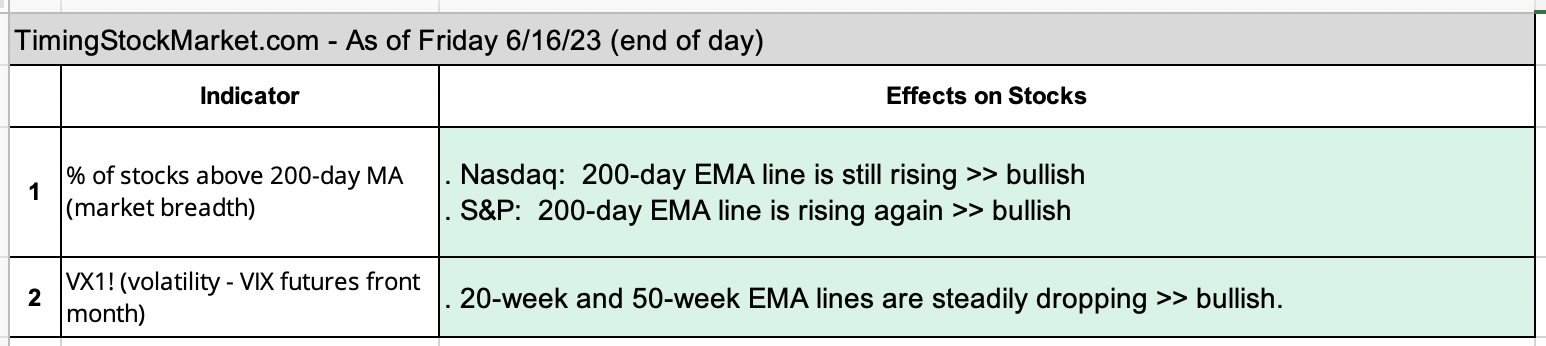 Multi-day Signal Indicators: Bullish but more dip warnings Background info on $VIX, $VVIX, SVXY, UVXY, ES, NQ RTY While the bull market remains intact, the multi-day indicators are sending out more warnings that a good size dip is very likely this week for ES NQ RTY SVIX SVXY. But this is only a dip that may last 1-2 days. It is not the start of a new bear market. 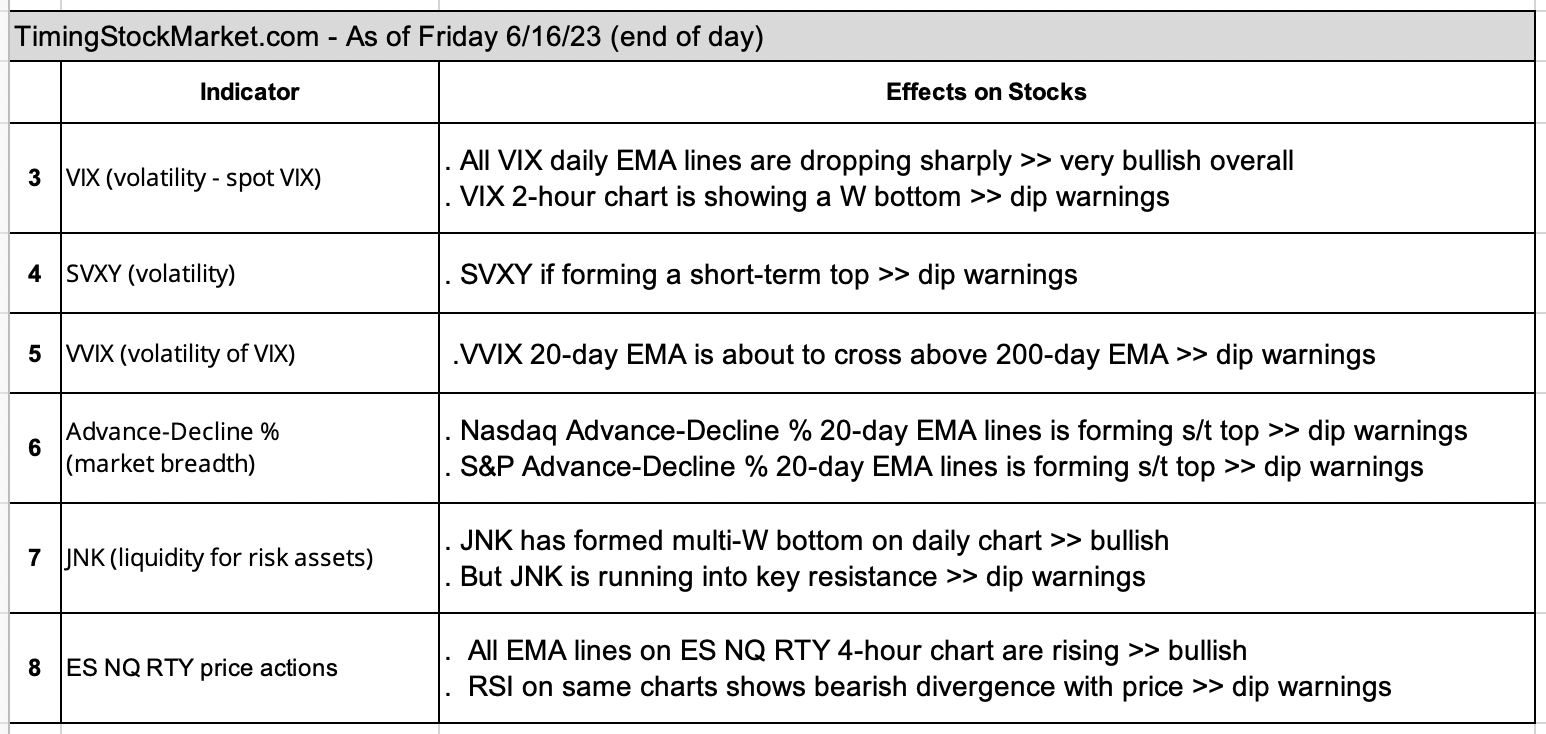 Key S/R levels NQ resistance levels have been updated. All others are the same. 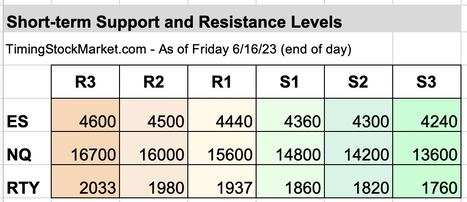 VIX and dip levels We want to share SVXY daily chart below to give you an idea of how the multi-day and multi-week signals have been unfolding since Feb 2. Admittedly, our system was not well equipped enough to catch all of the moves. Still we caught some, and used this data to fine tune the model.
We may see some choppy movements ahead of VIX OpEx on Wednesday, but overall we expect to see SVXY SVIX dip and then possibly bottom out in the zone around their 20-day EMA blue line (about 23 for SVIX). As for ES NQ RTY, they are likely to dip and retest S1 before bouncing up higher. 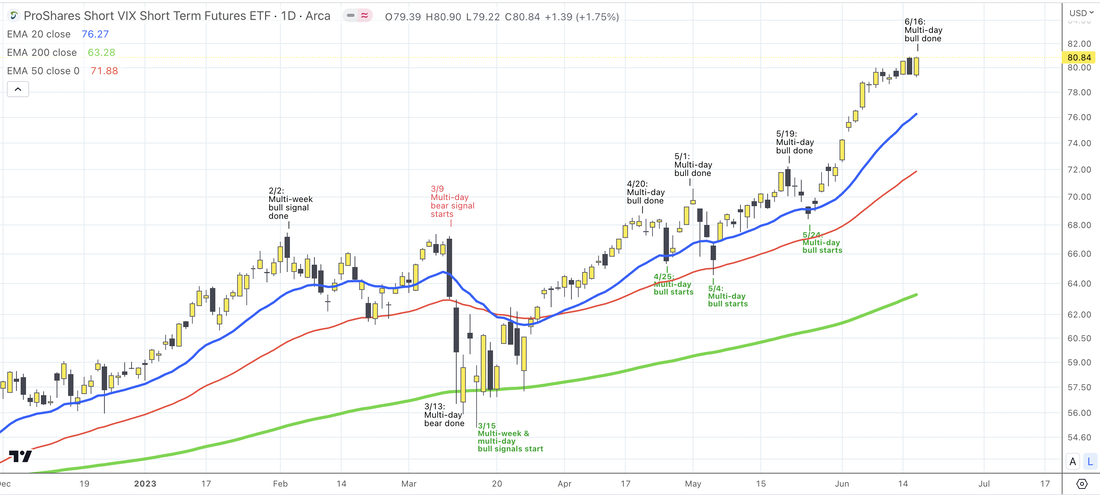 Our personal trade plan We currently have buy orders to scale into 2 SVIX positions when it gets down closer to its 20-day EMA blue line. Note that we're scaling in a pretty wide zone from 23.5 down to 22.7. In our experience, detecting the bottom of the dip is not easy. But after a medium dip, SVIX will try to retest the previous high before it drops lower, if it drops at all. Therefore we will hold off setting an immediate stop until SVIX 20-hour EMA line turns up from dipping. MEMBERS: Click here for Signal Trades spreadsheet. We have found that we have to analyze at least 3 time frames to get a feel for key S/R levels that are suitable for a given trade. Disclaimer The information presented here is our own personal opinion. Consider it as food for thought. We are not offering financial advice. We are not promoting any financial products. We are not registered financial advisers or licensed brokers. We make no guarantee that anything will unfold according to our projections. You are proceeding at your own risk if you follow our trades.
Updates 2:21 PM ET - Friday 5/26/23 Our SVIX trades so far We manually scaled into SVIX after PCE report per our trade plan from last night. Based on VIX patterns, VIX is still likely to retest 15.6 - 16.6 before launching into its 2nd "anxiety" spike. This means that SVIX is likely to retest near its May 19 high. We've tightened stop on 1/2 of our position to get out at breakeven, but removed stop on the other half to cope with big swings if they come. We intend to hold onto at least 1/2 position over the weekend. 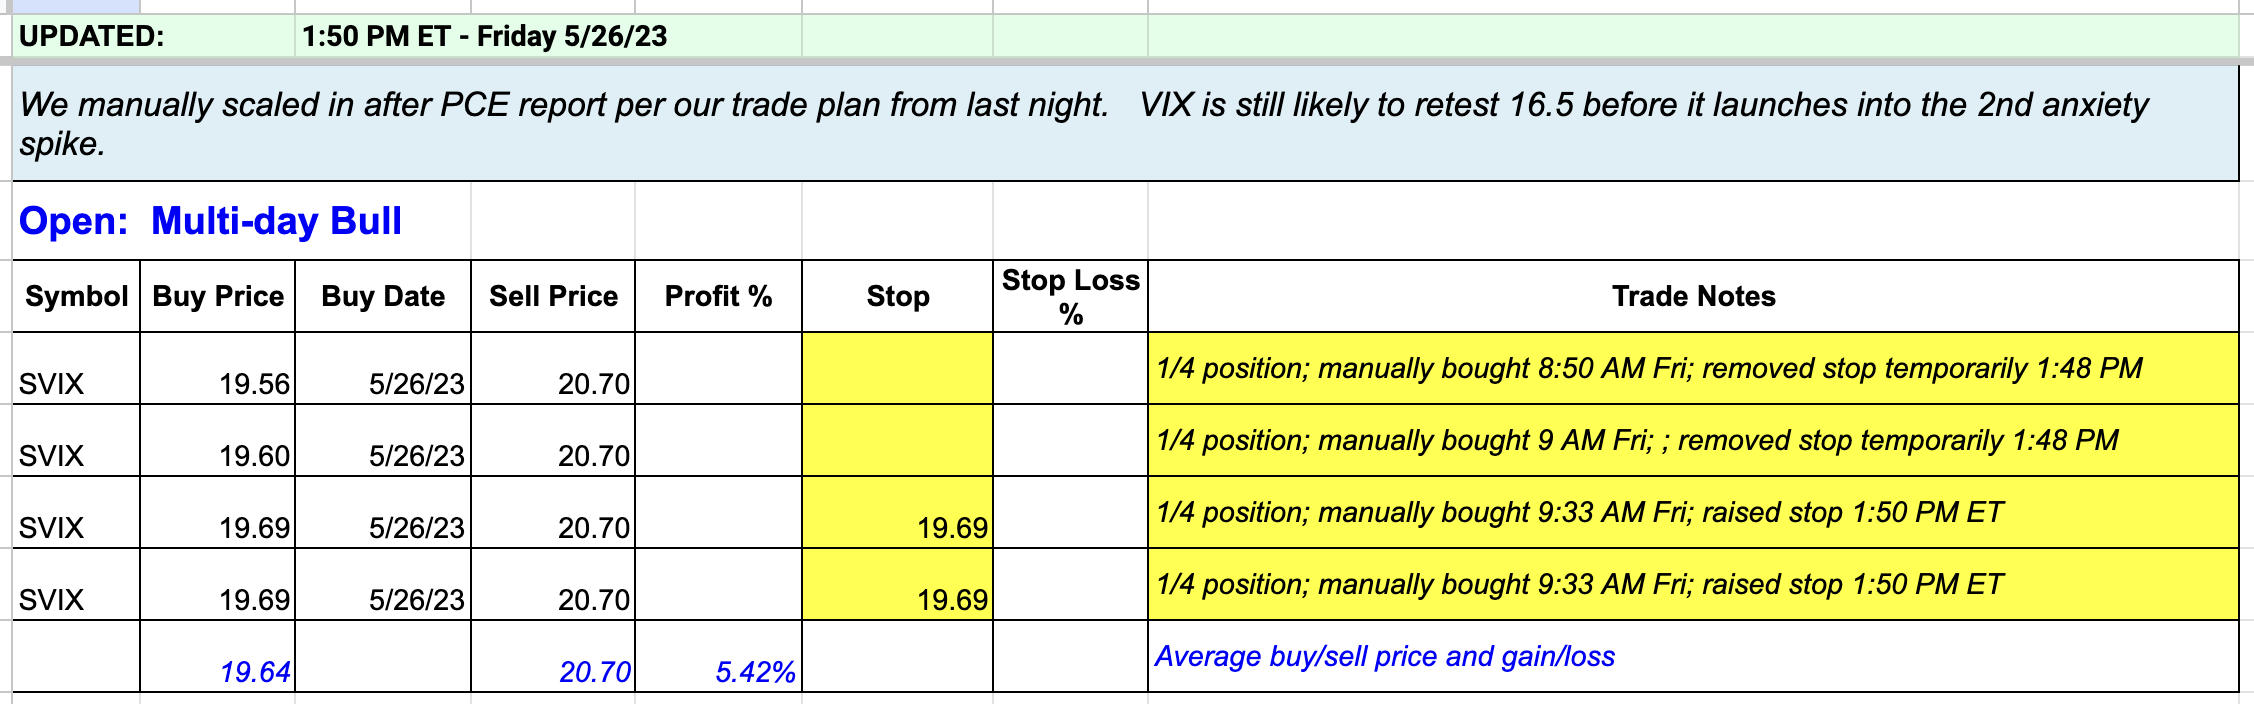 Updates 1:30 AM ET - Friday 5/26/23 Explanation of Indicators Background info on $VIX, $VVIX, ES, NQ RTY 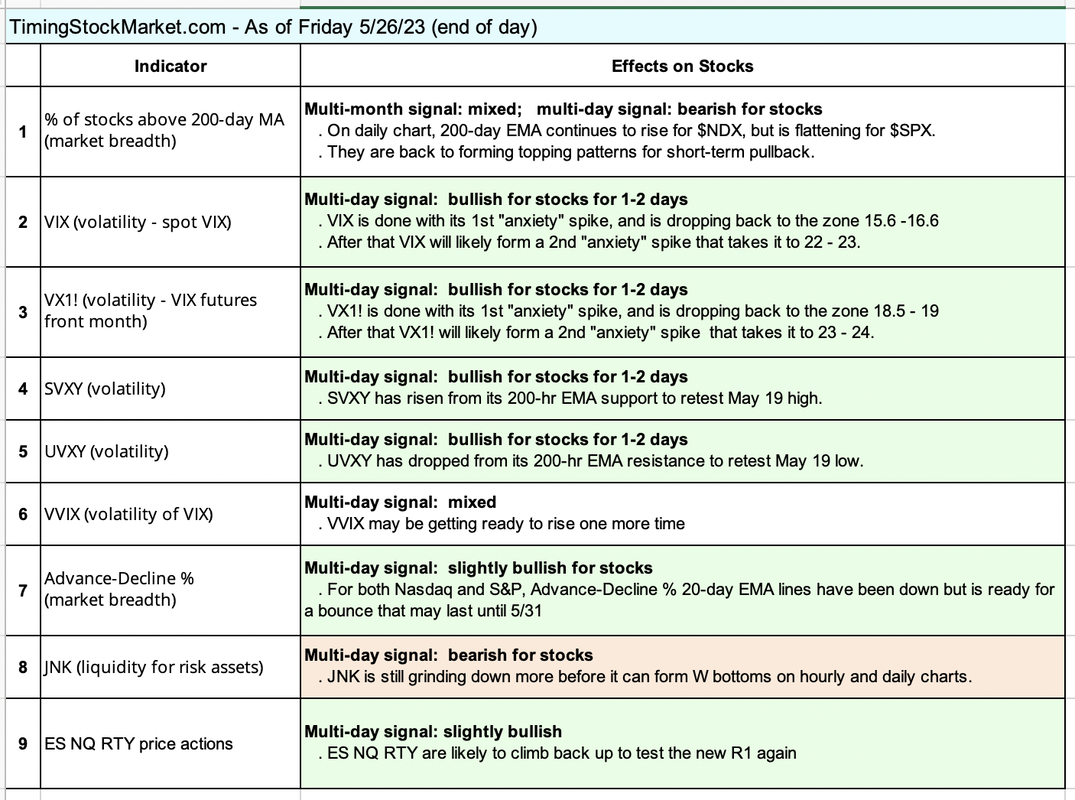 Key S/R levels RTY support levels have been updated. All other levels remain the same. 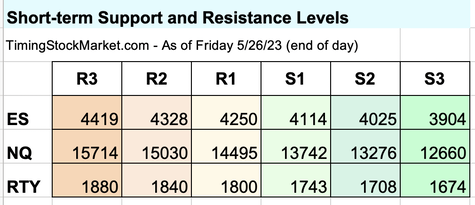 Projections Here are our updated projections.
An "anxiety" spike typically results in a moderate drop for ES NQ RTY. Right now, we don't see any VIX setup for a "real fear" spike, and certainly not a "panic" spike. Not yet anyway. However, after VIX reaches back into the support zone 15.6 - 16.4, it may form a 2nd "anxiety" spike. This 2nd spike may happen during the week of 6/12 with CPI, FOMC and June OpEx. This spike may take VIX up to 22 - 23 before it drops back down again. We don't have enough data at this point to project what will happen after the 2nd "anxiety" spike. But both bulls and bears should keep in mind that these "anxiety" spikes are short-lived and typically result in choppy price actions for ES NQ RTY. Our Personal Trade Plan
Click here for Signal Trades spreadsheet. Disclaimer The information presented here is our own personal opinion. Consider it as food for thought. We are not offering financial advice. We are not promoting any financial products. We are not registered financial advisers or licensed brokers. We make no guarantee that anything will unfold according to our projections. You are proceeding at your own risk if you follow our trades.
Updates 6:10 PM ET - Friday 5/5/23 Sold SVIX because... After hours analysis shows VIX is likely to rise sharply on Mon. We've decided to lock in our SVIX profit and re-enter Monday if SVIX dips substantially again. Sold full position SVIX at 18.5 after hours. (This alert was shared live on Twitter DM.) 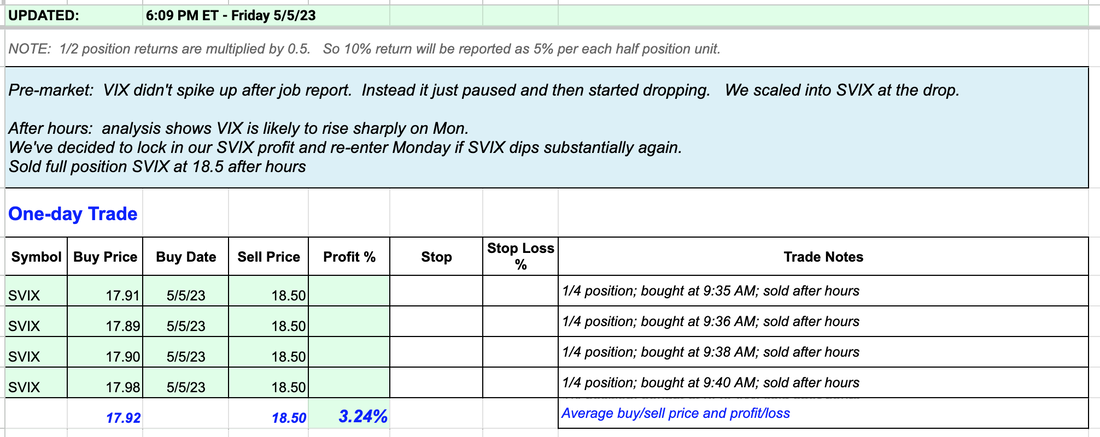 Updates 12:21 PM ET - Friday 5/5/23 Watch out for VIX bouncing VIX dropped right after the job report. VIX is now below all the EMA lines. It may start to bounce after such a sharp drop. This is why we raised SVIX stop. 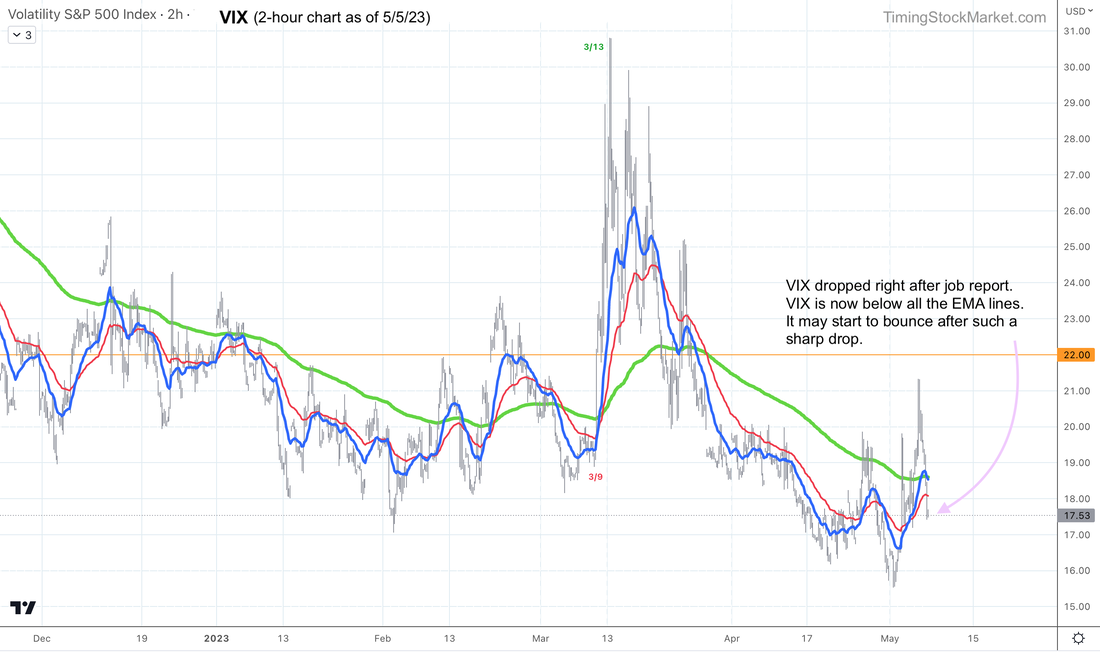 Entered SVIX per trading plan VIX didn't spike up after the job report. Instead it just paused and then started dropping. We scaled into SVIX at the drop. (This alert was shared live on Twitter DM.) 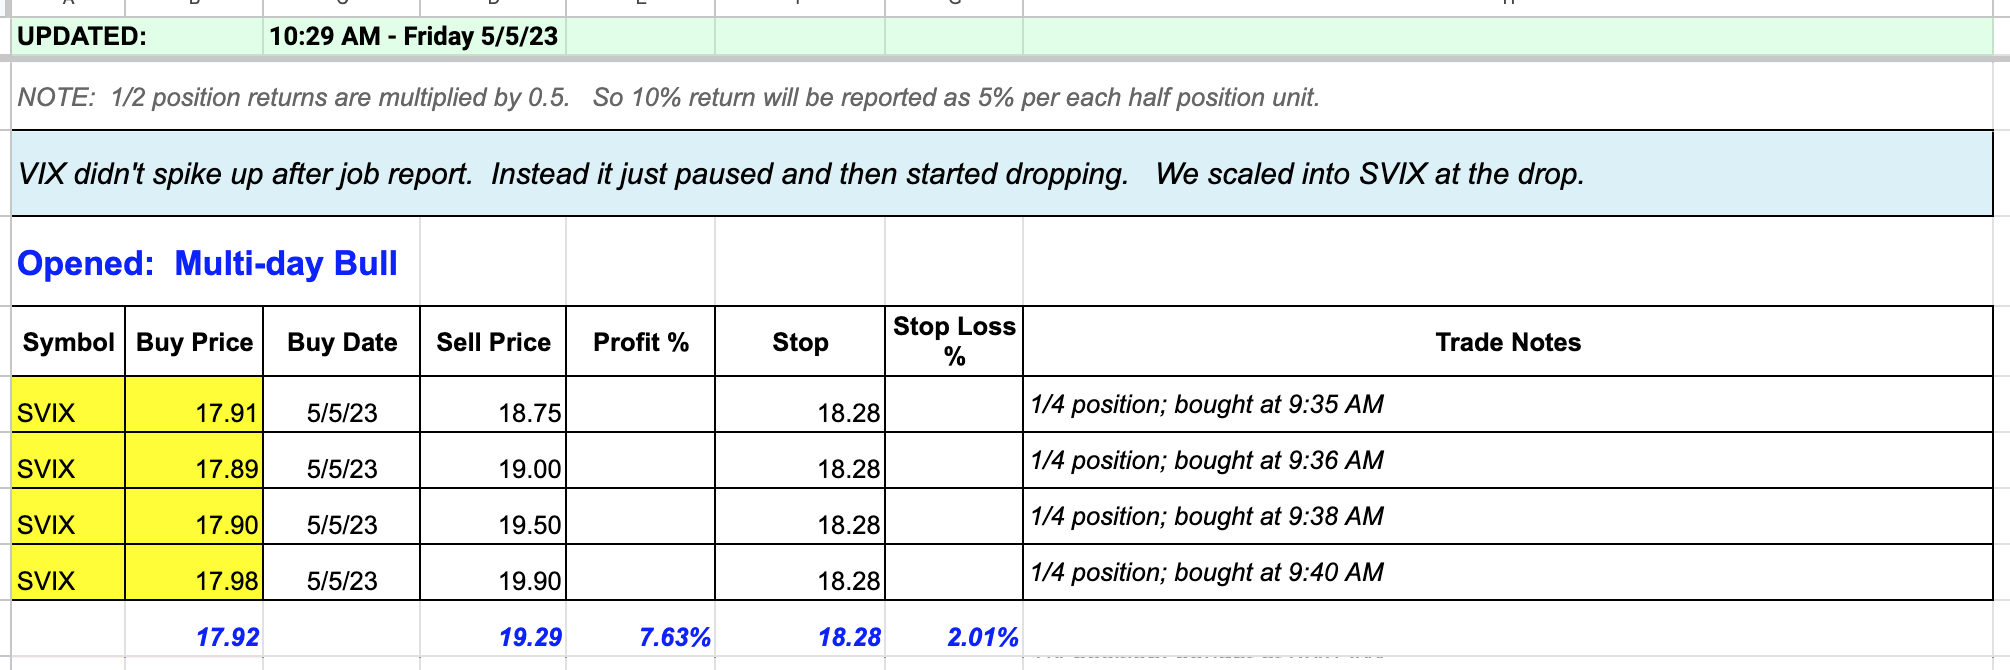 Updates 1:30 AM ET - Friday 5/5/23 Explanation of Indicators Background info on $VIX, $VVIX, ES, NQ RTY 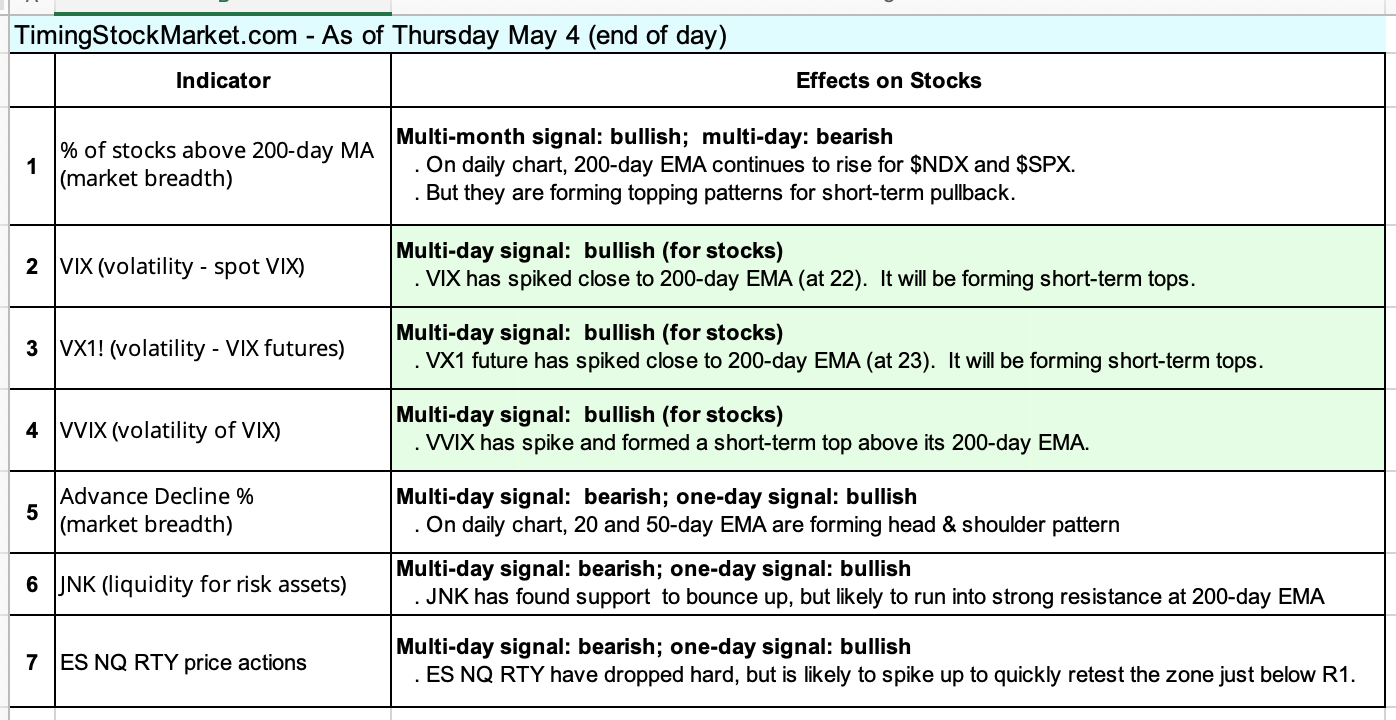 Key S/R levels The table below has been fully updated. 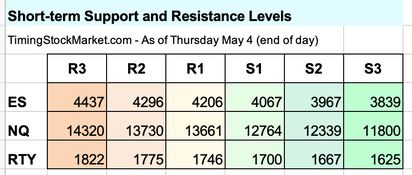 VIX rose higher on Thursday on fear of more regional banks collapsing. VIX got close to its 200-day EMA which is currently at 22. Our indicators are still leaning mildly bullish. So we are projecting that VIX will spike up to test 22 after the job report. Then VIX will likely begin its multi-day descend. VIX may drop as low as 16.6 before it builds a W bottom to surge up again. What will ES NQ RTY do while VIX drops? They are likely to rise up to retest R1. NQ may find enough bullish momentum to pierce R1, but ES and RTY are likely to run into major resistance at R1. We may see VIX drop steadily towards 16.6 while ES NQ RTY go sideway around R1 levels. Our Personal Trade Plan We want to capture VIX potential drop from 22 down to 16.6 zone. Click here for our buy orders. Disclaimer The information presented here is our own personal opinion. Consider it as food for thought. We are not offering financial advice. We are not promoting any financial products. We are not registered financial advisers or licensed brokers. We make no guarantee that anything will unfold according to our projections. You are proceeding at your own risk if you follow our trades.
Updates 7:15 PM ET - Sunday Upcoming key events The key event this week is VIX OpEx on Wednesday and OpEx on Friday. We will discuss more about this further below. 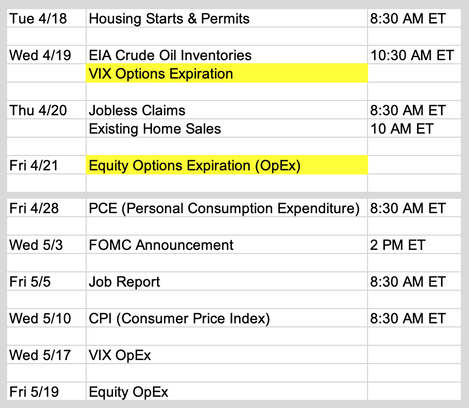 Earnings this week Chart courtesy of Earnings Whispers. Earnings season gets going in earnest this week with important reports from Tesla, Schwab, Bank of America, Netflix, Johnson & Johnson and Goldman Sachs. Traders will also be closely monitoring smaller regional banks for the viability of their earnings. (Read more on macro conditions here.) 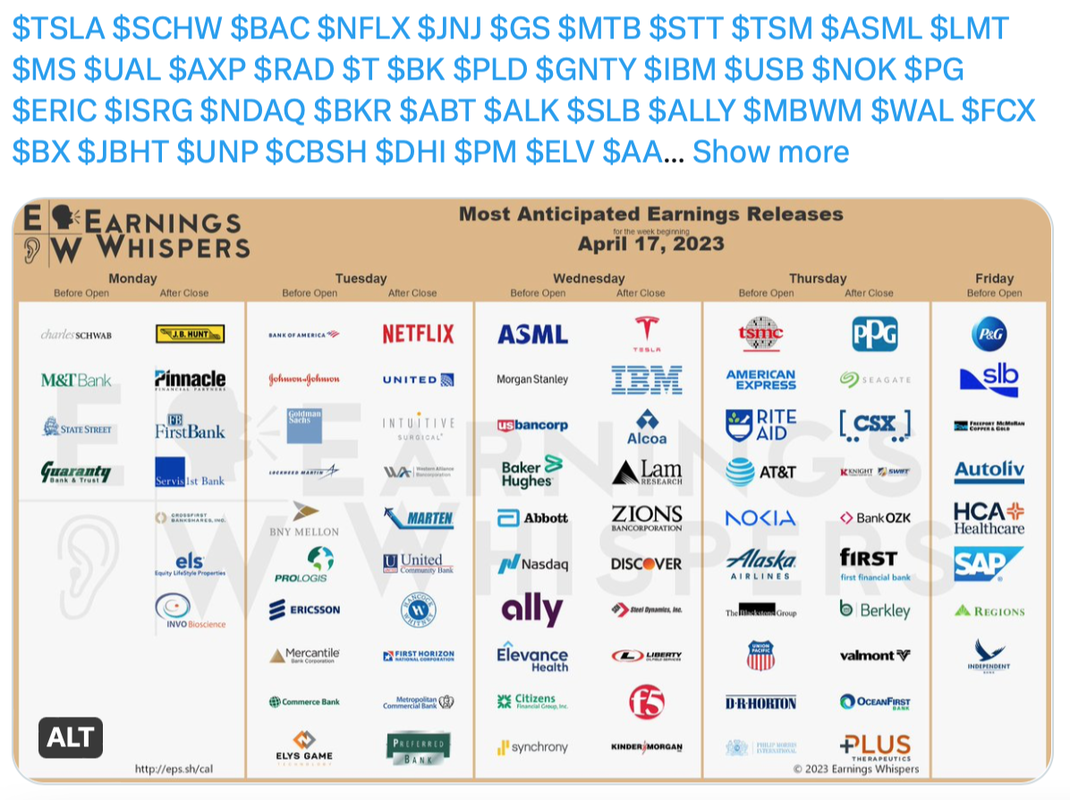  Key S/R levels The table has not changed. 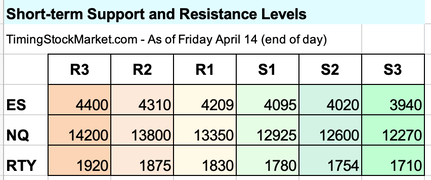 Our indicators are still mostly bullish (green). However, much of this has to do with $VIX dropping as VIX OpEx approaches (Wednesday 4/19). By Thursday, we may see VIX futures start to rise, and spot VIX ($VIX) may rise at the same time. However $VIX may not seriously rise until Monday April 24, after equity OpEx. What this means is that bulls should consider taking profits or tightening stops by Wednesday - Thursday this week. After that bulls and bears should both be patient because the period between VIX OpEx and equity OpEx can be unpredictable. Wait until VIX, market breadth and ES NQ RTY price patterns convey the same message (bullish vs. bearish) before scaling into the next multi-day position. Updated NQ projection:
ES and RTY are likely to follow the same path as NQ. Is volatility going to erupt next week? No. Even though $VIX is likely to rise after April 19, it is unlikely to exceed the zone 22-23. $VIX 20-day EMA blue line has not formed another W bottom yet (see red arrows). These W bottoms have to form repeatedly in the same zone for $VIX to take off. 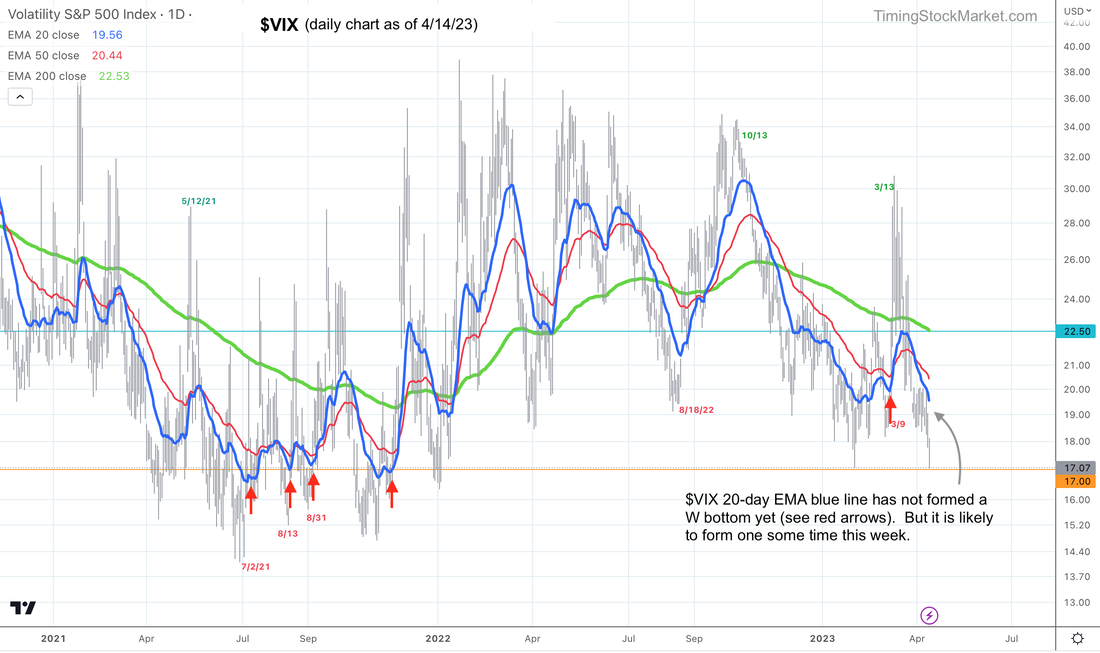 Our Personal Trade Plan On Friday, $VIX continues to drop as expected, but ES NQ RTY were not tracking $VIX moves as closely. Instead they dipped more than expected in the morning. This happens sometimes. The market acts more bearish than as reflected by $VIX. Our attempts to scale into bull position TNA resulted in a minor loss. But we re-entered one more time with a half-size TNA position to hold over the weekend. We plan to add the remaining half on Monday, and hold until Wednesday. See our buy orders in spreadsheet. Disclaimer The information presented here is our own personal opinion. Consider it as food for thought. We are not offering financial advice. We are not promoting any financial products. We are not registered financial advisers or licensed brokers. We make no guarantee that anything will unfold according to our projections. You are proceeding at your own risk if you follow our trades. |
Archives
July 2024
Categories |
 RSS Feed
|
|
Copyright (c) 2019-2024 LOOK Systems LLC
All rights reserved. |